JCMT - Better by design.
In the period from 1978 into 1981 my main task had been to help develop the initial mm-wave ‘common user’ heterodyne receivers for UKIRT. My part of the work concentrated on the mm-wave optics and some aspects of the mm-wave electronics. The optics involved introduced me to the use of Gaussian Beam Mode (GBM) analysis methods, and this proved to be an excellent approach for the work. As described on the previous webpage, near the end of 1981 I completed that and became involved in design and analysis for the James Clerk Maxwell Telescope (JCMT) project. My initial employment contract from QMC for this was for 18 months. Then, as now, employment as a Postdoctoral Researcher at University tended to be funded by a series of such short-term contracts.
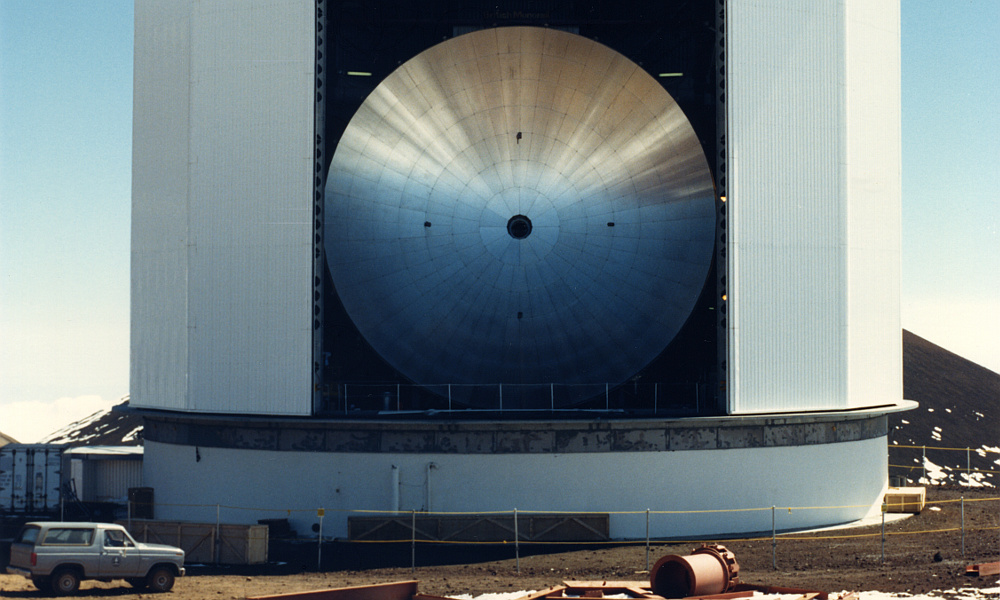
The above image (ROE 8702703) shows JCMT’s primary mirror before the secondary and its mounting structure were added. This allows us to get a head-on view of the central opening for Cassegrain / Nasmyth use, and also the locations where the secondary support would pass though the array of mirror panels.
|
As with UKIRT, JCMT came to occupy the bulk of my time. But my actual employment was with QMC and as result I did spend time on some other projects. For example in Jan 1982 I continued to do some work for QMC IRL. In part this was on designing mm-wave optics. However I also was busy for some days winding wire grid polarisers. The polarisers are a standard optical element in mm-wave instruments.
Making these required me to wind thousands of meters of either 10 or 25 micron diameter tungsten wire over grid frames and to then glue the wires onto the frames to make free-standing polarisers. The ‘glue’ used was a type of araldite thinned down to a runny consistency with an organic solvent, and then painted on with a small artist’s paintbrush. Quite a slow, fiddly job. It also involved solvents like Amyl Acetate and Toluene to clean the metalwork of the frames and ‘thin’ the araldite. At the time this was all done in an open lab, not in a fume cupboard, so a nightmare in modern ‘elf and safety’ terms! On occasion my skin developed a white dusting from the Amyl Acetate fumes. Each optical system or component was bespoke for a specific client/task and was sold via QMCIRL. I then designed them, and built or assembled and tested them.
During January there was also a JCMT planning meeting at QMC. This reported some changes to the planned telescope design and helped map out the aspects I should investigate over the next few months.
For the UKIRT receivers the most complicated portion of the optical analysis and design was the design of the diplexer which coupled the mixer to the telescope and the local oscillator which heterodyne systems require. The telescope optics were already largely determined because UKIRT was built and in use. I could therefore model the expected antenna pattern, beam efficiency, etc, for the receiver and then design a set of optics that gave the optimum results. When the system was tested we used Jupiter as an almost-point-source to confirm that the antenna pattern agreed with what the analysis had predicted some years earlier.
|
|
| Theoretical pattern
|
Measured pattern
|
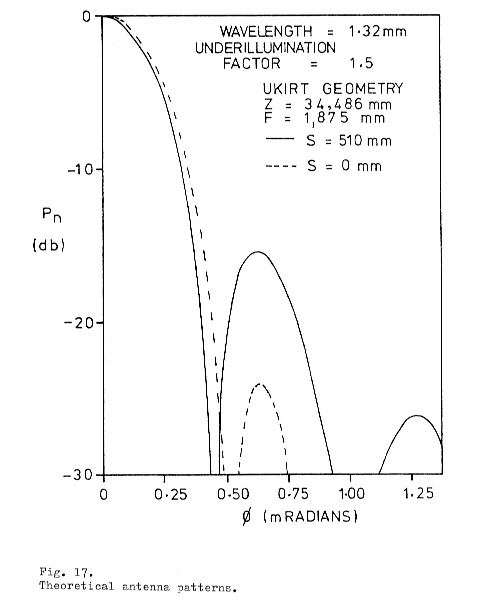
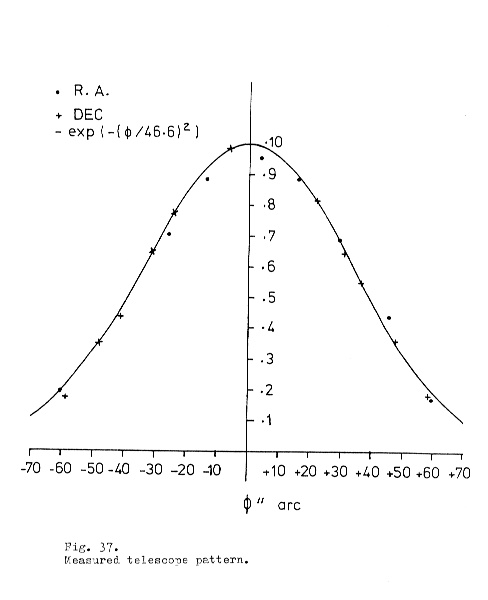
The above plots show the calculated and measured antenna patterns for System A operating on UKIRT at 230 MHz. (Taken from my thesis.) Note that these plots were for an underillumination ratio of 1·5. This sets the extent to which the sensitivity to incoming signal is deliberately tailored down at the edges of the mirrors in order to get a smoother antenna pattern.
The JCMT situation in 1982 was rather different. At that point it was still an evolving design that largely only existed on paper. This meant that whatever analysis or modelling processes I developed would have to be quickly adaptable and easily re-run whenever, say, someone decided that the size of the secondary mirror to be chosen should change. (Which, indeed, happened more than once during the design process!) There were also various extra complications we had been able to ignore when developing the ’System A’ and ‘System B’ receivers for UKIRT. These included factors like:
-
Allowing for spacial arrays of mixers/detectors to be used in parallel.
-
Having a membrane covering the telescope for various environmental reasons.
-
Ensuring the dome doors, etc, did not significantly degrade performance, despite possibly providing an opening that was only slightly wider than the primary mirror.
-
Use of beam-switched Nasmyth focus locations via a ‘beam line’ and series of mirrors.
And all the analysis needed to be done while ‘details’ like the door clearances, choice of membrane, etc still had not been finalised. In effect, a feedback process was under way as people involved assessed what might optimise performance, and what changes might cause problems that over-ruled any advantages. Many people worked on different parts of the design, and each had to keep adjusting to take into account what the others reported. A situation which will be very familiar for design engineers working on large project!
At the time, radio telescope designers tended to employ analysis methods based on approaches like the Fourier Transform (FT). From a mathematical point of view this is well suited to tasks like converting between the EM field patterns in the focal plane, primary aperture, and the far field angular antenna pattern. I’ve already outlined on another page that one practical drawback of this approach was that it tended in practice to rely upon using the technique of breaking down the problem into a lot of finite elements and running a (then) laborious number-crunching calculation on a large computer. These computational problems then duly expanded when you might want to take some of the above factors into account. Particularly when having to deal with calculations that dealt with the consequences which were in the mid- or near-field rather than at basic locations like the focal plane or far field! Fortunately, one of the features of GBM is that it provides a way to work out algebraic formulae that specify the field at all points along the beam. That, in turn, largely aced it’s way past some of the complications I’ve described. So the UKIRT work had provided a good basis for the JCMT modelling that followed.
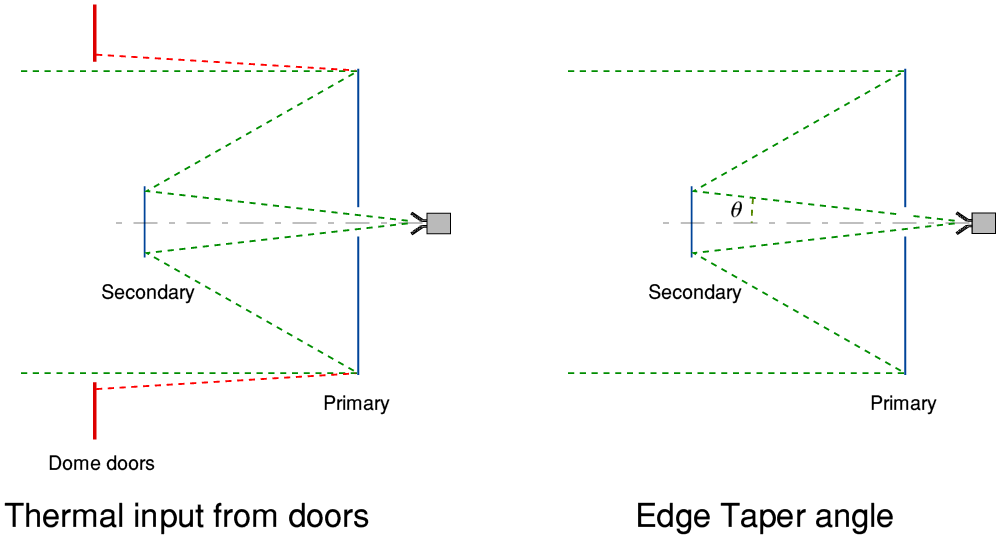
 Beam ‘overspill’
|
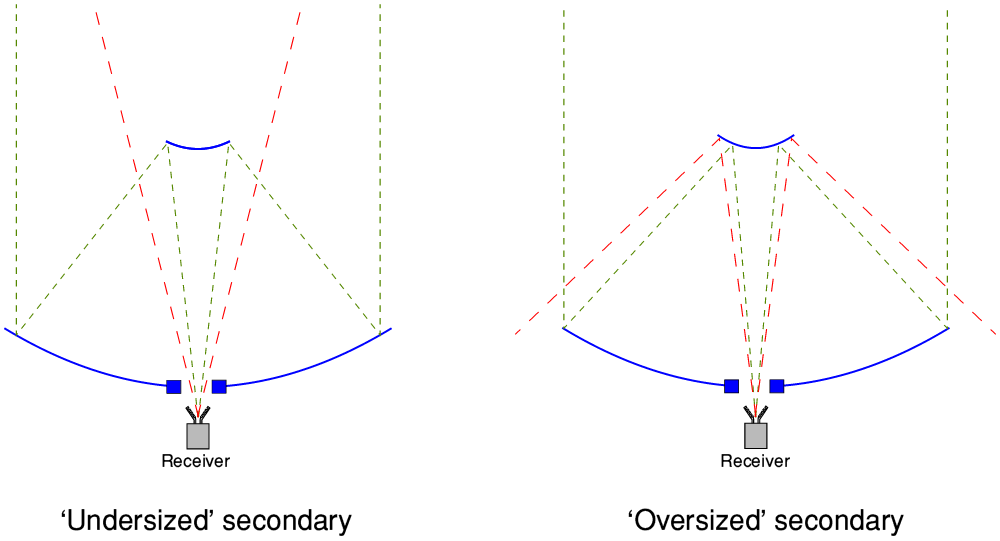
The basis of many of the aspects of the optical performance I was asked to investigate can be most easily explained by thinking in terms of the nominal ‘field of view’ of the receiver system as it uses the telescope to look at the sky. The JCMT optics required a number of elements to be taken into account, but the diagram above illustrates the general behaviour. In this diagram the angular field of view of the receiver is represented by the broken red lines. And for simplicity it only shows the simple Cassegrain telescope arrangement.
The diagram on the left shows the situation if the secondary mirror is ‘undersized’. Most of the receiver’s field of view will be filled by the signals collected by the primary and reflected from the secondary. However the receiver can also see past the edges of the secondary. As a result it also sees portions of the sky in a cone of directions around the secondary mirror. As a result, it will receive radiation from sources the telescope isn’t being aimed towards.
One of the reasons infrared and mm-wave astronomers wish to use telescopes located at high, dry sites is to try and get above as much of the atmosphere as they can. The main reason for this is that the atmosphere tends to absorb the radiation coming from astronomical sources. So it makes sense to want to locate a telescope where the atmosphere will transmit as much of the wanted signals from astronomical objects as possible. Hence the preference to place telescopes in high, dry places.
But the atmosphere also emits thermal radiation. And the lowest altitude, most dense, parts tend also to be the warmest, as well as being the most absorbing. The extent to which a layer of atmosphere will radiate thermal energy is directly related to its transparency. For example, if the atmospherealong a given line of sight transmits, say, 90%, at a a given frequency then the amount it will radiate will be 10% of what you’d get if the atmosphere were totally opaque. So going to a site where the air is transparent brings the bonus of also reducing the amount of unwanted thermal noise that the atmosphere adds to the signal! Given this, it may seem sensible that the system should avoid having an ‘undersized’ secondary because this lets in some thermal sky noise without contributing to the signal. But there is a snag...
The diagram on the right shows what can happen if the secondary is ‘oversized’ to avoid the above problem. The snag is that, now, the receiver will tend to see the floor or inside of the dome around the edges of the primary mirror. This will usually be a lot hotter and more emissive than the sky. For the sake of round numbers, consider a situation where both the atmosphere above the telescope and the telescope, dome, etc, are all at a physical temperature of 300 K. If the atmosphere has a transparency of 90% then the thermal noise from the atmosphere will be equivalent to just ten percent of 300 K – i.e. 30 K. This will be the case both for the desired beam and from any overspill around an undersized secondary. However if we oversize the secondary the overspill will tend to see the dome floor, etc.
Concrete tends to be rather opaque! Hence this will tend to look like a thermal source at about 300 K, not 30 K. As result, trying to dodge the ‘undersized secondary’ problem by deliberately choosing an ‘oversized’ one leads the infrared/mm-wave astronomer into a trap and means an even higher amount of unwanted added thermal input. This adds random noise and an unwanted offset to measured power values. The unwanted offset can be much larger than the actual astronomical contribution, making the measurement process more difficult. It can also saturate ultra-sensitive detectors and ruin their performance.
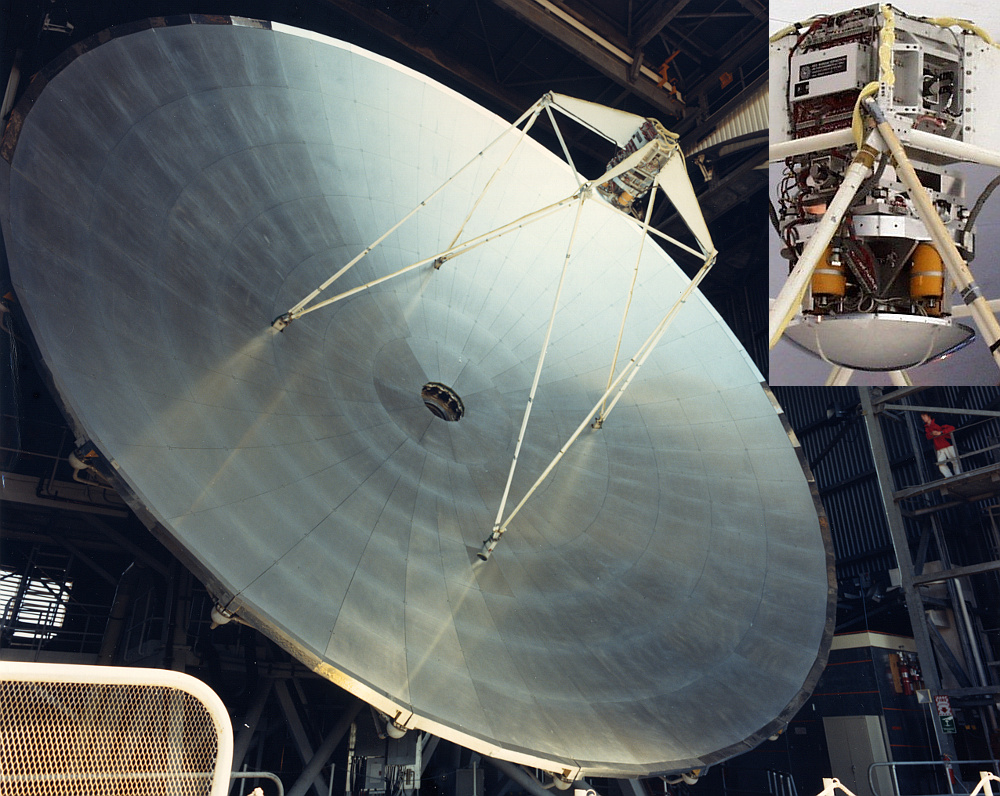
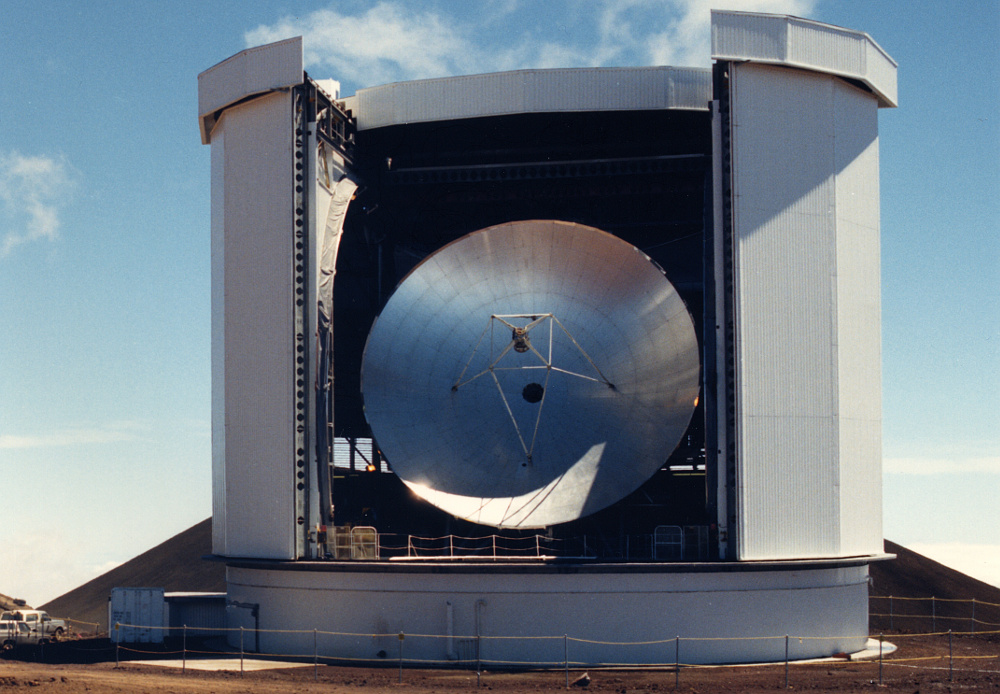
The main photo above (ROE 8911415) shows the JCMT with its secondary in place. The small inset image (IER) is a close-up of the secondary mirror and its position/movement/control systems.
|
In an ideal universe the solution would be obvious – match exactly the sizes of the secondary and primary mirrors to the complete field of view of the receiver. Nice idea in theory, and it would be a perfect solution. Sadly, mere reality turns out not to be willing to oblige. In practice the finite wavelength of electromagnetic radiation means it tends to diffract. One consequence of this is that it is actually impossible to produce a neat EM beam of radiation that has a perfect, sharp edged, profile at every place along the beam. An alternative is, of course. to ‘oversize’ both mirrors. However that means either spending extra money on an even bigger primary mirror that is larger than your detector can use, or using less of the existing primary.
As a consequence the general preference amongst infrared astronomers has been to err on the side of having an ‘undersized’ secondary. And mm-wave astronomers tended to adopt the same approach. That said, reality means that even this can’t be a perfect solution because diffraction will still occur and the scale of its effects increase with the wavelength of the radiation. So these effects need to be considered with particular care when it comes to mm-wave observations.
In general, mm-wave astronomers tend to develop receiver optics which have a sensitivity that tapers away as it approaches looking at the edges of the mirrors. For example, mixers constructed using waveguide and scalar feed antennas tend to have a sensitivity which varies with a Gaussian shape across their field of view. This helps reduce the above unwanted contributions. But still gives rise to scattering/diffraction effects due to the finite sizes of the optical elements. And the JCMT design included further elements which complicated its behaviour...
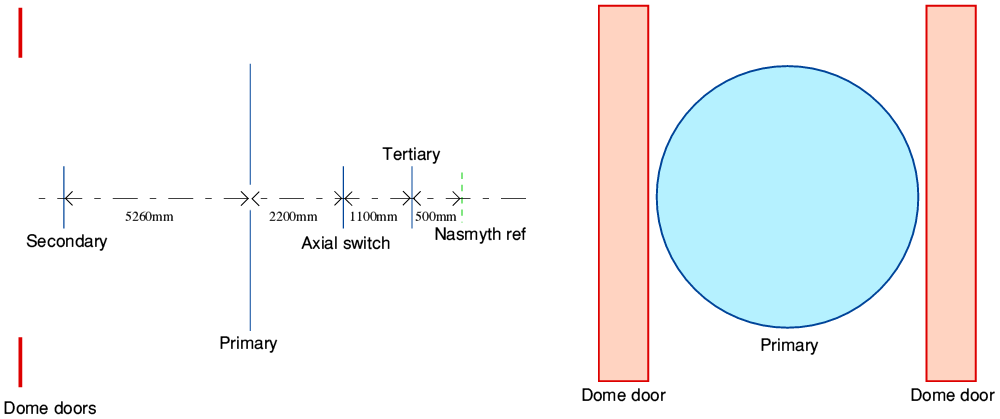 Schematic of JCMT optical train, etc, to Nasmyth (March 1982 arrangement).
|
The above diagram shows a simplified diagram of the optical train as proposed in March 1982. The incoming radiation has to get in though the opening between the dome doors, then gets a ‘hole’ punched in it by the secondary as it moved down to the primary. The primary reflects the resulting beam, focussing it back onto the secondary. This then reflects the beam again, down though a hole in the centre of the primary. If a receiver was being used at the Cassegrain focus it would at that point be focussed into the detector. However when using a Nasmyth focus, the beam is diverted by a ‘switch’ mirror that directs the radiation along the telescope’s elevation axis. For JCMT this beam is refocused by a tertiary mirror before reaching the defined reference input plane for the optical input of a receiver at a Nasmyth focus. At each stage along the train some further truncation effects may occur.
In practice antenna design engineers often make use of a theoretical trick and treat a receiving system as if it were actually a transmission arrangement. (This relies on the symmetry properties of Maxwell’s Equations and the coherence of the EM waves involved.) We can then begin with the antenna pattern of the feed horn that couples the detector to the telescope optics, and project this back up the system. Each optical element in turn may truncate and alter the beam which it then (mainly!) passes on to the next, until the result (mostly!) emerges as a wavefront out of the dome doors. This lets us determine the resulting overall antenna efficiency, angular pattern, etc. In addition, the tendency of each optical element to generate diffraction that may let the receiver ‘see’ other, unwanted, items can be assessed. By using GBM to model the system it becomes possible to answer specific questions and to give a general guide to how much clearance the beams should be allowed along the entire length of the optical train and the beam runs in between those elements.
One particular concern at the time was the question of how much clearance was required to keep the dome doors sufficiently away from the telescope beam. Given a primary mirror 15 metres in diameter it made obvious sense that the edges of the dome doors should be more than 15 meters apart. Question was, how much more? This mattered because the wider the gap, the larger and/or more expensive the building might need to be. UKIRT wasn’t the only telescope where cost was a concern and thus there was pressure to approach the ideal beloved of bean-counters: The biggest telescope possible in the smallest possible dome! Hence at that time the proposal was to allow around 100 mm of clearance. i.e. each door edge would sit at 7.6 m away from the centre of the telescope beam.
The diagram on the left, above, illustrates the problem. On the basis of schoolbook ‘ray optics’ the field of view of the receiver might be assumed to be limited to the region bounded by the broken green lines. However diffraction effects – mainly those caused by the finite diameter of the primary mirror - can allow some thermal radiation from the dome doors to reach the detector. By using GBM analysis it was possible to determine that even with the small door clearance the effect would be low.
In practice, many of the detailed properties of an antenna system depend on the way in which they are illuminated by the chosen receiver system’s optics. (Note that the term ‘illuminated’ here is commonly used for receiving systems because of the general time-reversable nature of the arguments used for both receiving and transmitted antennas.) Although the general shape of this illumination was likely to have a Gaussian profile – as used for the UKIRT example illustrated near the top of this page – one of the variables considered during the design period was the choice of what is called the ‘edge taper’.
The on the right, above, shows that radiation arriving from via the edge of the mirrors will reach the receiver along a direction at an angle (represented by the greek theta) relative to the optical axis. The sensitivity of a typical receiver varies with the direction of arrival of incoming signal power. In general it will be most sensitive for radiation arriving along the axial direction. The edge taper value is the relative sensitivity to power arriving from the direction (theta) of the edges of the mirror compared with that for power in the axial direction. For a Gaussian Beam profile the edge taper value can be related directly to the ‘underillumination radio’ used for the UKIRT example. Put simply, the higher the underillumination ratio, the greater the extent to which the sensitivity to signal from the edges is reduced.
Alas, as ever, there is a trade-off which the choice of edge taper / underillumination ratio requires us to make. The higher the degree of edge taper, the smoother the resulting antenna pattern tends to become, and unwanted sidelodes or diffraction problems tend to be reduced. That helps to avoid problems like getting unwanted thermal radiation from dome doors, etc. The snag is that having a very distinct edge taper means we aren’t really using the outer areas of the mirrors very effectively to gather signal into the receiver. So the overall efficiency of signal power collection falls.
An added problem is that a high edge taper / underillumination ratio also tends to broaden the width of the antenna’s main lobe, thus degrading the available angular resolution. When designing an optical train, the choice also affects the required clearances and sizes throughout the system. In the end, yer pays yer money and yer takes yer choice!... but for the designers it means having to re-do the calculations whenever someone decides to move one of the deckchairs. Often with the result showing that the deckchair is best quietly shuffled back to where it was in the first place.
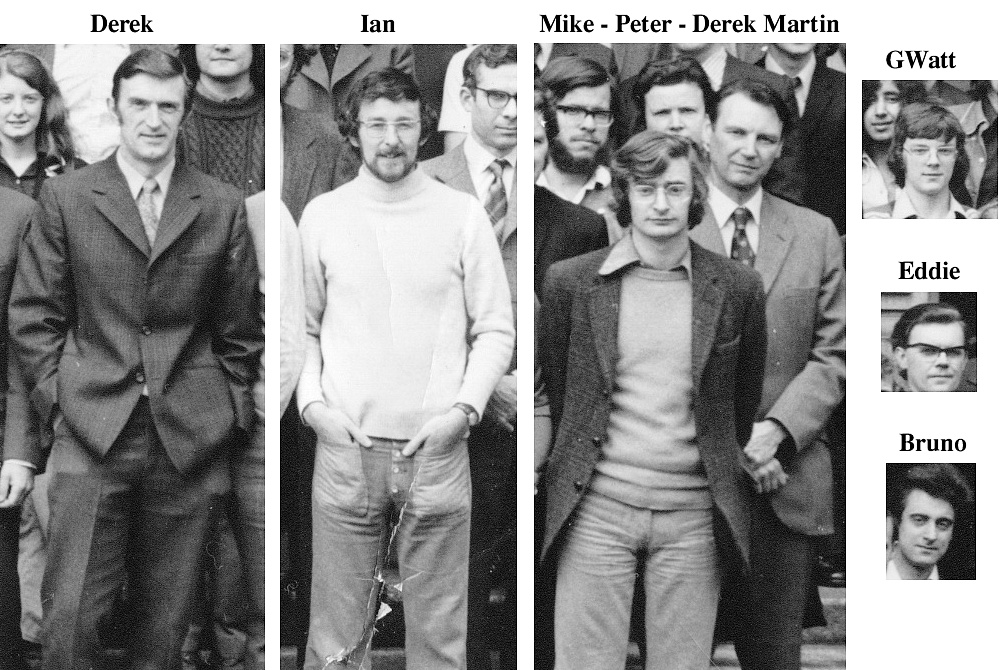
The above shows some of the people working on mm-wave systems or astronomy at QMC around 1980. Derek Vikers was a technician in the Astro Group. In addition to Ian Robson and Peter Ade the montage shows Derek Martin standing behind Peter, Graeme Watt top right, with Eddie Puplett below him. Bottom right is Bruno Carli who worked in collaboration with Derek Martin for many years. Mike Pugh was a research student in the Astro Group. Alas, because the photo is monochrome we can’t see how brightly colourful Ian’s trousers were at the time. He may have been aiming at the highest possible colour temperature!
|
Prof Derek Martin led the QMC Engineering Physics group and acted as my direct supervisor for all the work I was doing. During April 1982 he asked me to help build an InSb detector as part of a plasma diagnostics instrument for the Joint European Torus (JET). This involved me deciding what type of bolometer geometry should be used, and also required developing improved low noise amplifiers for use with the detector. This work was being done via Liz Baker at the NPL for Alan Costley’s group at JET. A complication was that a student researcher funded by the Chinese government had been working on building a detector which was being considered for this. But it wasn’t clear if that would be suitable, or ready in time. I had also agreed to go along on an observing trip to use UKIRT at the end of the year.
April 1982 was a strange period because it was the first time in my life that I became aware the United Kingdom might get into a war in my adult lifetime. I was used to the idea of reading about wars in history books or hearing my parents talking about their experiences before I was born. But with a Task Force out at sea, steaming down towards the Falkland Islands, I realised that people were likely to die quite soon during the combat that would be engaged in to regain the Islands. My main feeling at the time was that it was a serious political failure that our Government had allowed the situation to get this bad. One that would cost lives.
During April I went out a couple of times with Brenda. She didn’t work at QMC. I’d met her a year or two earlier. John Scott was (and is!) a great friend I’d got to know at School. I’d met Brenda because she was a friend of his sister, Kim. We’d got on well and had been out together a few times. This was to a large extent another result of the way Chris Adams was encouraging me to go out with other women in the hope that she could palm me off on someone else. I had also been out a few times with Jannette who was a QMC postdoc studying quantum gravity. (Nope, I don’t understand it, either!) As a result Chris ended up commenting that I must be the envy of half the department because I went out with so many attractive women!
Brenda worked very hard at a job in shipping, and had an important exam approaching. So I’d sent her a card and gift to wish her good luck. Unfortunately, I think she read more into this than I’d intended. I guess I’d got so used to going out and being with various women I’d got to know via QMC that I’d misjudged what her reaction might be. As a result she became more reluctant to see me again. So we ceased going out. This was a shame as I’d enjoyed her company.
At the same time, Joy – who was a computer assistant in the QMC Physics dept – said to me when a group of us were in the bar one night that her boyfriend was jealous and she didn’t like it. Joking, I said that she could always get rid of him and come out with me! I then felt quite flattered when she said that if she went out with me she would feel jealous of the other women I’d been out with. It was lightly meant, but a nice thing to say. And it helped me at a time when I was feeling sad that I’d given Brenda the wrong impression. Sadly, I long ago lost contact with Joy and Brenda so I don’t know how either of them fared later on.
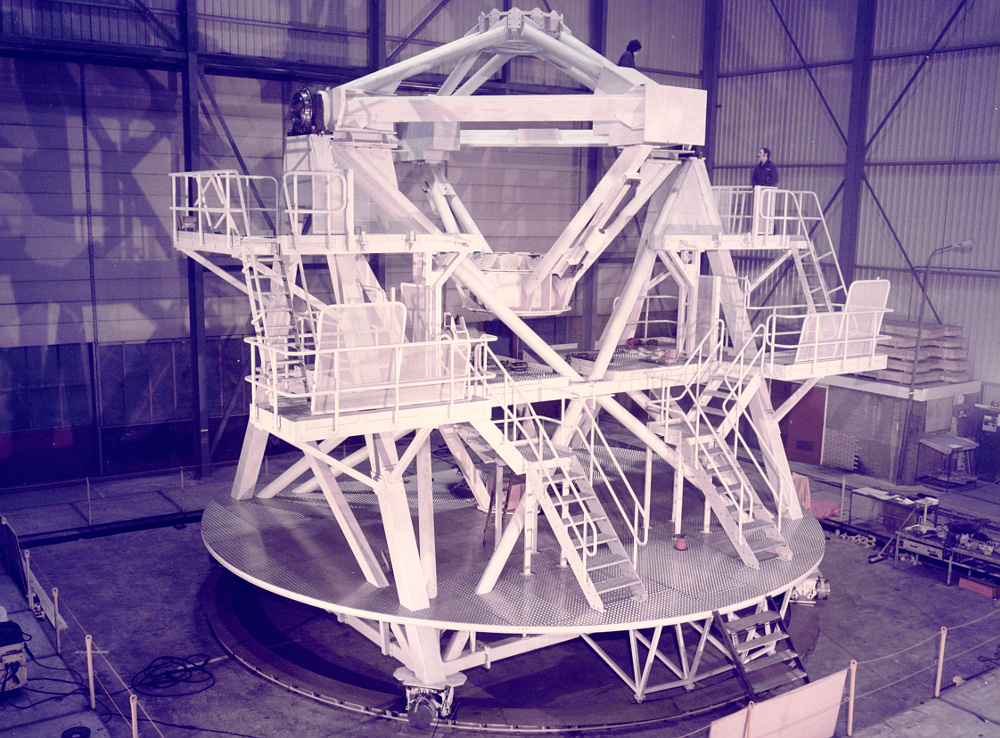
The above shows a partially assembled JCMT. (RAL 85RC1331) Without the mirrors and their support structures this gives a clearer view of the Nasmyth platforms and the ports at the ends of the azimuth axis where the Nasmyth optical beams would emerge.
|
Around 1980, millimetre-wave astronomy using heterodyne receivers was in its infancy. However for some types of observations the heterodyne approach offered some very useful advantages over using thermal detectors (bolometers). The most obvious difference being when it came to making high resolution spectral observations of the emissions from astronomical sources. Bolometric (also often called ‘thermal’ or ‘continuum’) detectors would essentially absorb a wide range of frequencies and ‘heat up’ by an amount that could be sensed. This allowed them to detect a wide range of EM frequencies, and that helped them to become very sensitive. But to make spectral measurements they then require an additional system of some kind – possibly a set of selectable bandpass optical filters or some form of interferometer.
The existing mm-wave heterodyne receivers which were based on a cooled InSb mixer had a detection bandwidth of around a few MHz. At, say, the Carbon Monoxide line frequency of 230 GHz, 1 MHz represents a fractional bandwidth of 0·00043% or 4·3 parts per million. Measurements using these mixers worked by controlling and stepping or sweeping the local oscillator frequency to generate a measured spectrum. In practice an output filter could be employed to narrow the resolution to a MHz or less. So spectral measurements with a resolution of the order of 1 part per million were quite feasible. Although it did require a very stable and accurate LO frequency control system. Whereas trying to match this resolution with, say, a two-beam interferometer and a bolometer would have required an optical instrument that could most politely be described as, erm, ‘rather large’ even by JCMT standards!
Heterodyne receivers based on using Shottky diodes, etc, had a much wider bandwidth than InSb. The wider bandwidth tends to collect more signal power, but their output can then be passed through signal processing systems that allow higher spectral resolution to be obtained. So they can match the resolution of an InSb mixer system. However their big advantage is that such processing can recover high resolution measurements for many different narrow frequencies bands in parallel. In effect, making many spectral measurements simultaneously.
The Shottky mixer has what is called a ‘multiplex advantage’ over the InSb mixer. In effect, it can collect signal power arriving in a whole series of 1 MHz bands of the spectrum simultaneously. The InSb mixer can only see a specific 1 MHz band at any time. The drawback of the Shottky mixer is that it required a might larger amount of LO power in order to work well. But given this it is able to collect spectral data much more efficiently. Information engineers agree with politicians and civil servants that, “Information is Power”, but for rather different reasons, based on Information Theory!
Unfortunately, early trips with mm-wave heterodyne receivers to various telescopes threw up a problem which initially puzzled astronomers. When mounted on a telescope an odd behaviour arose which hadn’t generally been seen back in the research lab when the receiver was being developed. The output spectra obtained during observations exhibited periodic ‘ripples’ on a small frequency scale... Not quite the kind of mm-wave ‘waves’ the astronomers had in mind!
Superimposed on the spectral shapes the astronomers had expected were a regular series of peaks and dips. And the details of these varied according to which telescope was being used, etc. Because of this, one of the early areas I investigated was the question of these ripples, their cause, and to decide if the JCMT might give different behaviour to UKIRT or other telescopes that mm-wave observers were at that point familiar with using.
The reason for this unwanted effect had actually shown up much earlier when I was carrying out tests on the ‘duralhenge’ benchtop prototype for the diplexer arrangement that was eventually adopted for the original ‘System A’ heterodyne receiver commissioned for UKIRT. The optical system was arranged to convey Local Oscillator (LO) power to the mixer. To beam the LO (and signal) a set of lenses, etc, were used. In principle, the lenses would bring the LO to a focus (actually a beam waist) at a particular distance from the source. This was. nominally, where the mixer’s feed horn was then located.
Moving the mixer in a way that changed this distance can be expected to cause the amount of LO getting into the mixer to be a maximum in one optimum location, and it should fall gradually as the mixer is moved away from this optimum spot. In effect, shifting the mixer will move the arrangement ‘out of focus’.
 Reflections and echoes.
|
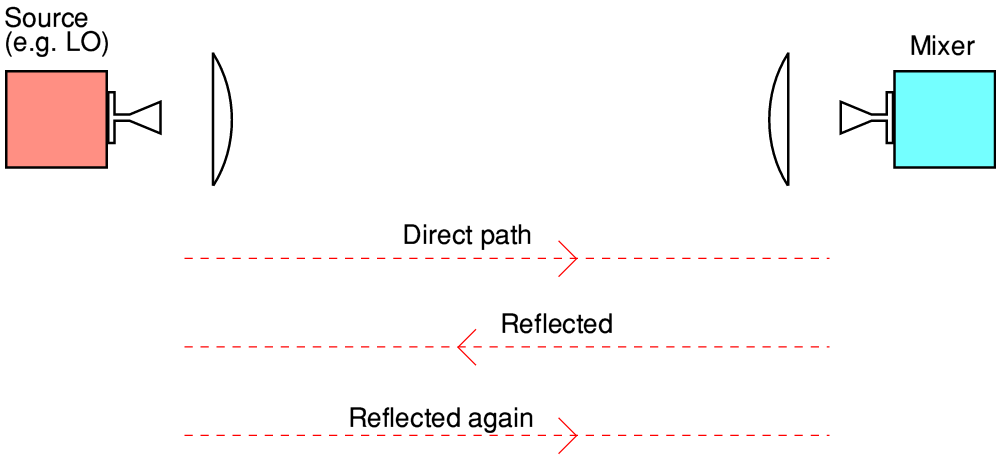
However in practice I found that the detected level varied up and down in a series of cycles as the distance was altered. This was because the mixer tended to reflect some of the arriving LO (and signal). The reflected LO power then was send back towards its origin though the optics. When it returned to the oscillator, some of it was, again reflected, and then came back to the mixer. This meant that in addition to the ‘direct’ LO power, the mixer would also see a smaller amount that had been taken on this longer journey, arriving after a time delay. Indeed, some of this would be reflected again, and then again, leading to a series of fading echos, each arriving after further delays.
Now for some particular path lengths these reflections might all arrive at the mixer in phase, and add up neatly. The result being a maximum LO power getting to the actual mixer. But for other path lengths the reflections would have various phases, and then would not add up so neatly to a maximum. The result being a lower LO power reaching the actual mixer. The key factor here being the effective ‘round trip’ distance measured in wavelengths. When the round trip distance was effectively an integer number of wavelengths, the behaviour gave a maximum result. Which in turn quickly warns us that the behaviour of the system is now frequency dependent! (Niggling detail for perfectionists: In practice we’d need to take other effects like beam diffraction into account as that alters the effective wavelength.) In practical terms, the optical system has, unintentionally, included a form of Fabry-Perot resonator.
For the bench prototype system I found that adding a carefully chosen sheet of semi-reflector over the feed horn on the mixer could help to cancel its tendency to reflect LO or signal power. This removed the problem on a test bench as well as maximising performance. But this added another adjustment which the user would have to make correctly when they wanted to change to observe at a different frequency. So the ideal solution was to make better mixers that didn’t reflect a noticeable amount of the LO (or signal). Alas, for the early generations of mm-wave heterodyne mixers this was easier said than done, and at first the cause of the ripples wasn’t widely understood.
 Receiver and it’s reflected image in secondary.
|
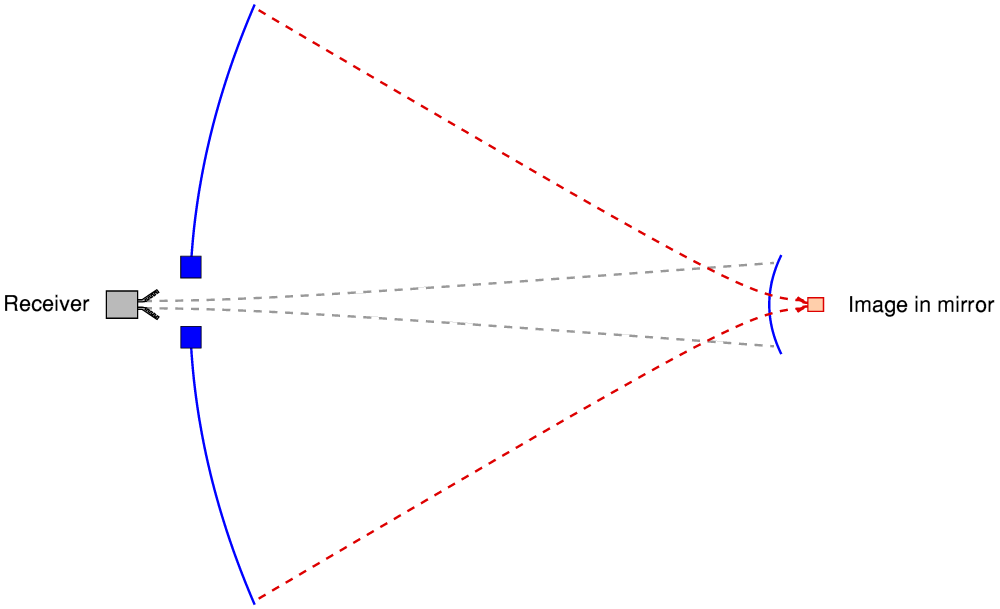
The relevance of this to telescope use can be seen from the above diagram. This shows a receiver’s mixer mounted at the Cassegrain focus of a telescope. In effect, the receiver is ‘looking’ up at the secondary mirror and is meant to collect signal power coming down from that mirror. However since the secondary is a mirror, the receiver can ‘see’ a modified image of itself in the secondary. This opens up two possible forms of the problem.
 Ways that FP behaviour can arise.
|
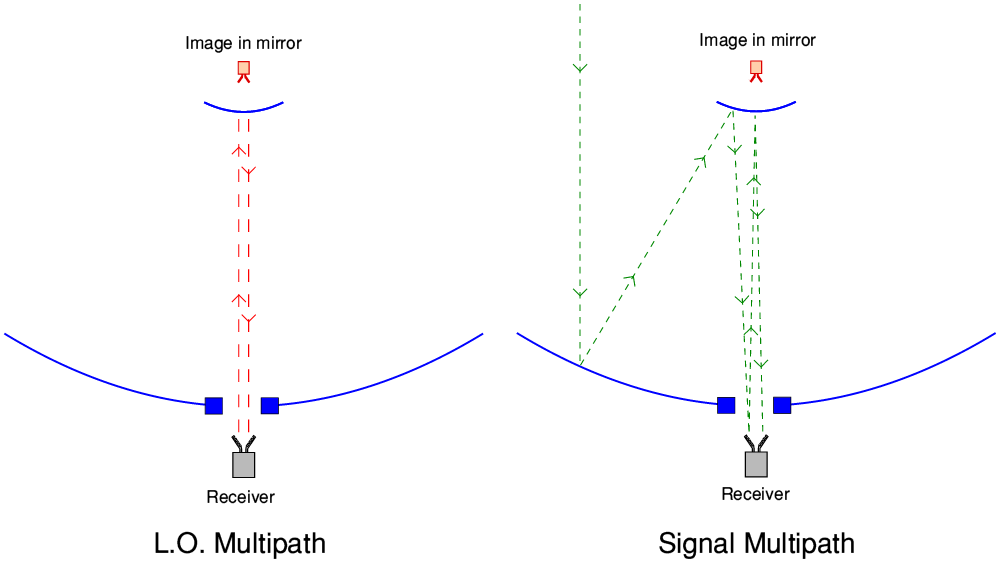
The first is illustrated on the left, above. Here some of the LO is being reflected back up towards the secondary. Most of this will then be beamed out into space. But some of it will reflect back directly towards the receiver. In effect, the receiver sees a reflection of itself in the secondary, radiating delayed LO towards the receiver. This reflected contribution can then change the gain of the mixer. This was the effect that became obvious on the UKIRT bench prototype. The second form of the problem is illustrated on the right. Here some of the incoming signal is reflected by the receiver and then gets reflected again, seeming to come back from an image of the receiver in the secondary. In both cases the telescope + receiver can act as a Fabry-Perot Resonator and cause the LO and/or signal levels to become frequency dependent.
The LO effect was usually only significant for systems that use an InSb mixer because these had to sweep or step the LO frequency to cover a spectrum range. As this was done the resonance caused the LO level entering the mixer – and hence the mixer’s sensitivity – to alter. The later systems that use wideband diodes could use an LO frequency that was fixed during an observation. So for those, only the signal resonator effect might matter. Although there was still the risk that when the LO frequency was changed the receiver’s sensitivity would alter, and thus might not be optimum. Fortunately, that was often fixable by tweaking the receiver.
The larger the telescope (in particular, the longer the distance from receiver to secondary), the quicker’ any change in frequency may affect behaviour. For the sake of example, consider a system where the distance between the receiver and secondary is, say, 5 metres, and observations are being made an 1 mm wavelength. This means the ‘round trip’ distance for our unintended FP is 10,000 wavelengths. This means a change in frequency of about 0·01% will take us from 10,000 wavelengths to 10,001 wavelengths – i.e. though a full cycle of variations in any change in sensitivity caused by this problem. That in turn corresponds to a change in frequency of around 30 MHz. Hence you might get ripples in the resulting spectra with peak or dips just 30 MHz apart.
Such effects would, back then, usually passed un-noticed when using bolometric detectors and bandpass filters because they would often have such a wide bandwidth that the ripples were averaged away for each measurement. The result would only have shown up as a slight reduction in the signal collection efficiency. However, given the ability of heterodyne systems to observe with frequency resolutions of the order of a MHz, the ripples could be very evident. And because JCMT was much larger than UKIRT, their frequency scale would be finer when using JCMT. At the time some astronomers had adopted a trick of attaching a small disc of mm-wave absorbing material (generally eccosorb, a trade-named absorber) to the centre of the secondary. This tended to reduce the ripples, but at the expense of degrading other aspects of performance. However the result of the analysis was to indicate that the best solution was to minimise any tendency for the receiver to reflect signal or emit LO!
|
|
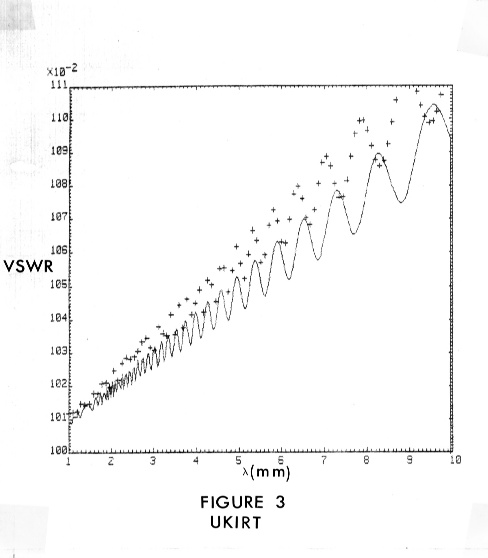
| UKIRT VSWR
|
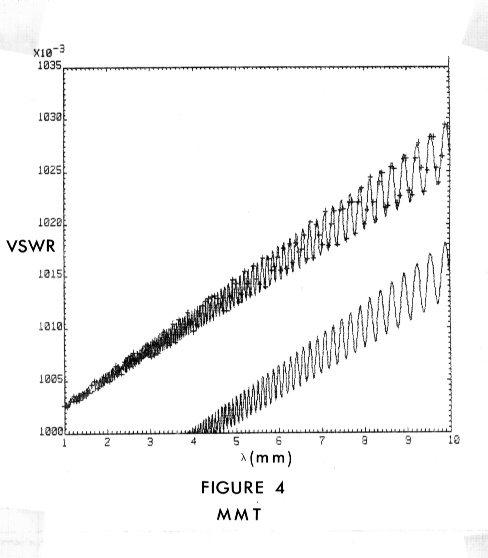
JCMT (MMT) VSWR
|
The graph on the left was calculated using the actual UKIRT geometry. The one on the right using a typical set of design assumptions for JCMT during mid-1982. Each shows how the unwanted levels of reflection can be predicted to vary with signal wavelength. (Note that the ripples in these graphs are caused by some secondary mirror effects I’ve not explained!)
The graphs have been taken from a JCMT report I wrote in 1982. Perhaps the most significant result can be seen simply by noting that the vertical scales are different! VSWR is a measure of signal reflectivity used by microwave and communications engineers. A VSWR value of ‘1’ means no reflection at all. So, ideally, we’d want to see VSWR values as close to unity as possible. Simply as a result of the different geometries, it can be seen that the effect should be much lower for JCMT (referred to as ‘MMT’ in 1982). The series of crosses shows the results for an unmodified telescope. The smooth lines assume that a small disc of microwave absorber has been placed at the centre of the telescope’s secondary which, geometrically, fits into the shadow region projected by the secondary onto the primary. For UKIRT (and some other telescopes) this noticeably reduced the level of unwanted reflectivity. However even without any similar treatment, the JCMT geometries showed a much lower anticipated level of the problem.
Having investigated, it became clear that in practice – provided receiver designers/users understood the cause – the problem was best dealt with by ensuring the receiver didn’t waste any signal or LO by letting it get reflected up the telescope! I did design a form of ‘reflection nulling tuner’ that could be added to a secondary to cancel the problems. This could do a better job than a disc of absorber, and could be remotely adjusted. Its effect is illustrated by the lower line in the above ‘MMT’ graph. But in practice it seemed unlikely once the problem was understood that anyone would ever need it.
 View of JCMT from outside the dome. (ROE 8911427A)
|
My thanks to The Royal Observatory Edinburgh, Rutherford Appleton Lab, and Ian Robson for some of the photos on this page.
Jim Lesurf
13th Dec 2017
6000 Words