|
|
| Nigel Cronin as Napoleon | Me as Groucho Marx |
Life on the Millimetre-Wave
Early in 1978 I returned to Queen Mary College, London (now Queen Mary, University of London) as a member of the Engineering Physics Group headed by Prof. Derek Martin. My initial 3-year appointment was to work on a project to produce ‘User Receivers’ for the United Kingdom Infra-Red Telescope on Hawai’i. These were intended to be commissioned and then left at UKIRT for astronomers to use as a common facility. So in addition to working well, they had to be reasonably ‘astronomer-proof’. That said, in reality the technology was so cutting edge at the time that almost anyone wanting to use them would have needed help from someone already experienced in their use!
The team which had been brought together to design, build, test, and commission the receivers was spread over more than one university. The project leader was Dr Richard Hills at Cambridge, and a group at Kent University were tasked with producing the system which would analyse the signals when the system was operating on the telescope. The Appleton Laboratory (before it was merged with the Rutherford Laboratory) also supplied a key part of the system.
At QMC the two main researchers were myself and Nigel Cronin. By this stage Nigel had obtained his PhD and his supervisor – Tom Philips – had left QMC to return to the USA. So now, both Nigel and I were working for Derek Martin. Tom having left, Genn White of QMC had taken over the use of Tom Philip’s mm-wave equipment and was also involved in the project.
My previous experience at QMC was using what are called ‘bolometric’ detectors. These work on the basis that far-infrared radiation hitting the detector element warms it up slightly, altering its resistance. Hence you can detect the radiation by measuring the tiny change in resistance. These were the detectors I’d become familiar with during my previous work with the QMC Astro group. However the UKIRT systems operated in a quite different way. These were to be heterodyne receivers.
|
|
|
| Nigel Cronin as Napoleon | Me as Groucho Marx |
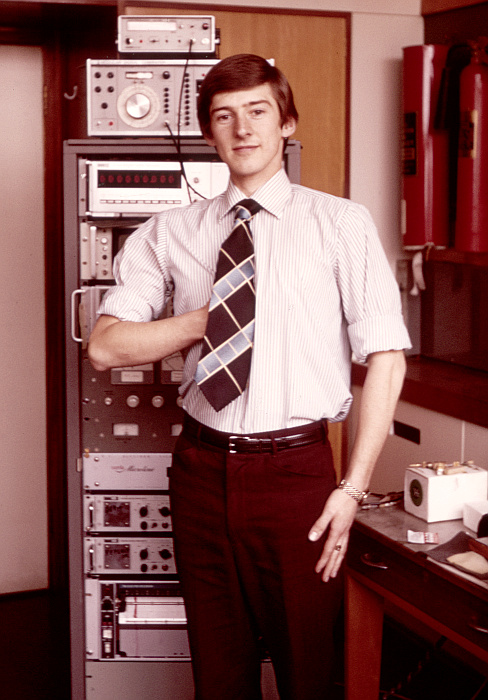
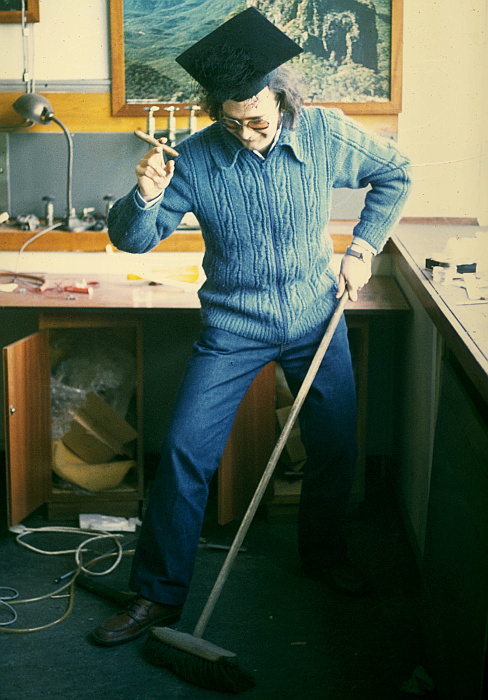
The above photos show Nigel and myself at the time. We had been allocated an office and lab space. The photo of myself was taken when we were cleaning out the room that would become our office. Nigel is standing in front of a 19 inch rack unit that held the electronics to run a millimetre-wave heterodyne receiver.
In principle, these receivers operate just like a normal radio set. The incoming wanted signal is ‘mixed’ (combined with) a ‘local oscillator’ in a suitable device – e.g. a diode. This then generates a new signal which can be at a much lower frequency. For example, in a domestic FM radio, the wanted radio signal might be at about 100 MHz. The radio picks this up and mixes it with, say, the output from a local oscillator at 110 MHz to produce a result at just 10 MHz. This is then fed though some amplifiers and filters to select and boost the level. There are two advantages of this approach. Firstly, the bulk of the system only has to work at a relatively low frequency, which makes it easier to get good performance. Secondly, you can easily re-tune the set by altering the local oscillator frequency. That’s the principle. But the challenge was that in our case the systems had to receive and analyse signals at frequencies around 230,000 MHz (230 GHz) and 345,000 MHz (345 GHz). At that time very few devices could be made that would work at these very high frequencies, well above all the normal radio and microwave bands. So the systems and devices had to push the state of the art.
In a way, my part of the work was essentially another form of circuit design. However whereas in the past that would have meant my using printed circuit boards, transistors, resistors, etc, now it was totally different. I was having to design what came to be called ‘Quasi-Optical’ circuitry. The basic ‘circuit design’ was a relatively simple one. The challenge was that it had to take the astronomical signal from the telescope and from the local oscillator as optical beams and direct them both – with minimal loss – into the heterodyne mixer. Microwave engineers tend to think of using metal waveguides, but they tend to have a very high loss at these frequencies, so we had to beam the mm-wave around though free space to keep the losses as low as possible!
The optical arrangements also had to reject any noise produced by the local oscillator at the wanted signal frequency, so had to act as a filter, whilst passing the wanted signals at this frequency coming from the telescope. It was also important to avoid any of the signal or local oscillator being reflected back up the telescope as that could also have caused problems. On top of this, optical diffraction was a serious concern because of the wavelengths involved. So the kind of basic ray optics they teach in school wouldn’t have produced a working design.
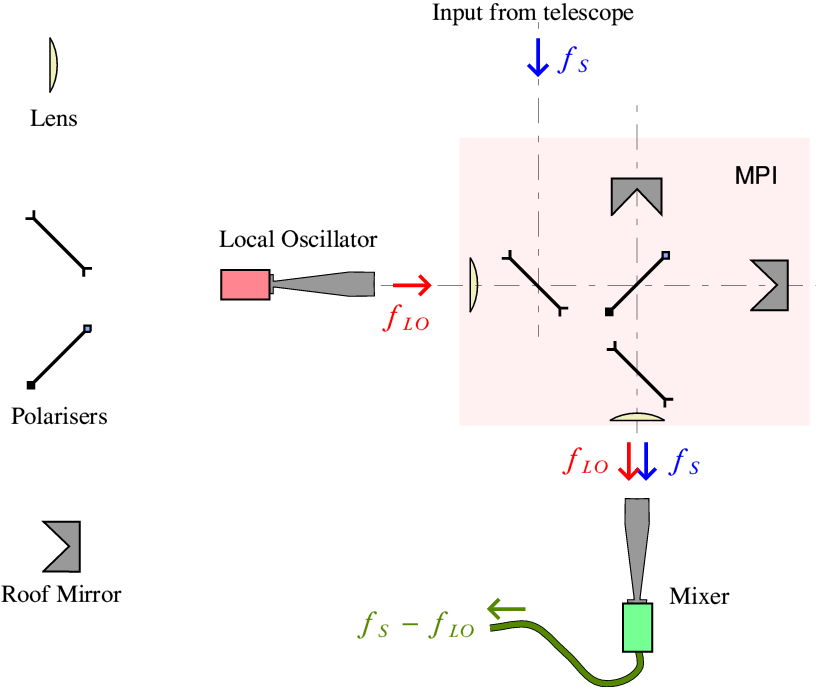
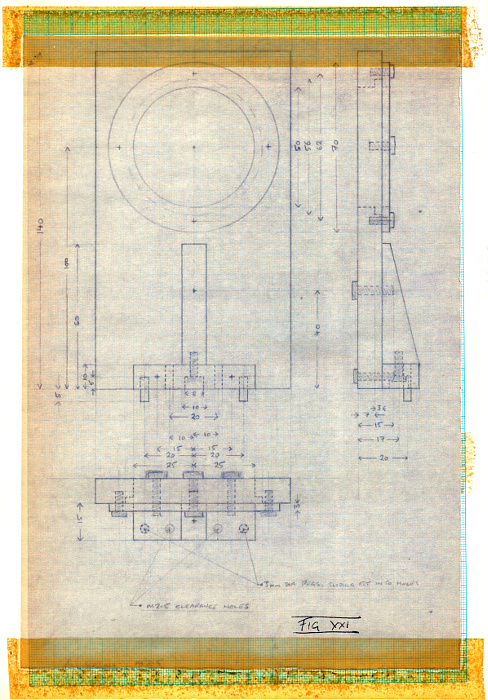
Circuit diagram of the MPI Diplexer. |
If you are interested you can find out a little more about the Quasi-Optical circuits by looking at sections 10 and 11 of the set of pages here.
The circuit chosen for the UKIRT system is based on the ‘MPI’. This stands either for ‘Michaelson Polarising Interferometer’ or ‘Martin-Puplett Interferometer’ depending who you are talking to. It is derived from the standard Michaelson two-beam interferometer, but has a number of advantages over the original. It was invented and first used by Derek Martin and his long-term technical co-worker, Eddie Puplett. Here the arrangement is being used as what is called a ‘diplexer’ because it combines two different sources (with different frequencies) together.
The actual basic ‘circuit’ arrangement required is shown above using the symbols we adopted for the components involved. In terms of logic and number of components the arrangement is a simple one, so the real emphasis was on the quality of the components and how well the design details were carried though. (I’ve omitted some parts of the actual practical optics for the sake of clarity.) To turn the conceptional design into a real one, work had to start almost from scratch.
In effect, the situation was akin to a designer of Hi-Fi being told, “Here is the circuit schematic. It is a nice simple design. However for it to work as required you’ll have to find all the raw materials and work out how to make all the individual resistors, capacitors, etc, by hand. Standard off-the-shelf components aren’t available that will be good enough.” So a job that might seem conceptually easy then becomes a journey of discovery, invention, hard work, and ingenuity...
For example, it is one thing to say “we’ll have a lens here”. However, designing the actual lens and manufacturing it then had to be done. This had to begin with surveying available candidates for the material to be used. In the mm-wave frequency range glass is totally opaque, so useless as a lens material! Hence step one was to buy samples of various polymer materials and then do measurements on them to try and determine their refractive index and how attenuating they would be. From that work the best candidates were high density polyethylene (HDPE) and PTFE. But even then, the samples showed these varied from one sample to another. No-one was making these with any idea they’d be used for mm-wave lenses. They were being produced to allow companies to make beer crates, double-glazing window frames, etc! So having made initial measurements, it was necessary to collect some large rods of the best material, sample each, then use the best as if those rods material was like bottles of a fine vintage wine which might never come again.
Of course, it wasn’t possible to decide what the exact lens shape would be until the precise mm-wave properties of the actual material to be used was established. And because the lenses were only a few dozen wavelengths in diameter, diffraction had to also be taken into account when calculating the required shapes. The lens surfaces also had to have carefully sized regular grooved cut into them as a a reflection-reducing measure. The actual lenses were then manufactured in the QMC Physics workshop by turning them on a lathe. This was a challenge and required quite skilled and experienced machinists. The materials tended to distort as they were cut, and a lot of care and judgement was required. So a real challenge to get good results.
During the initial months of work I decided that it would be safest to first design a system that could easily be used on a lab bench as a breadboard to check how various components would work together. That would then allow for tweaking before the final design to fit onto the telescope was made. The initial test design was quickly named ‘Duralhenge’ because it reminded everyone of Stonehenge but was made from dural – a convenient aluminium alloy that was easy to machine.
The polarisers were in the form of plane arrays of parallel metal wires. Nothing like the materials used in polarising sunglasses! This meant buying fine (25 micron diameter) tungsten wire from Mullard who made it for incandescent lamps, etc. Then designing and building ‘frames’ onto which I then had to wind the wires using a standard coil-winder which was originally made to wind transformers. Then I had to carefully glue the wires to the frames, producing a suitable ‘window’ of an array of close spaced parallel wires. Which meant learning how to do the entire process well enough.
|
|
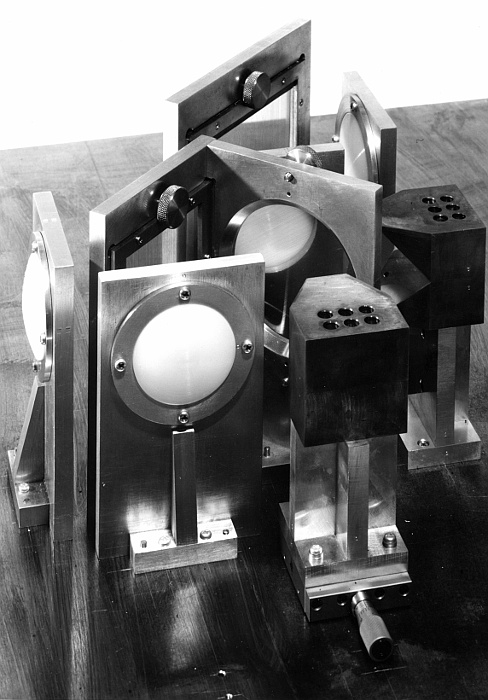
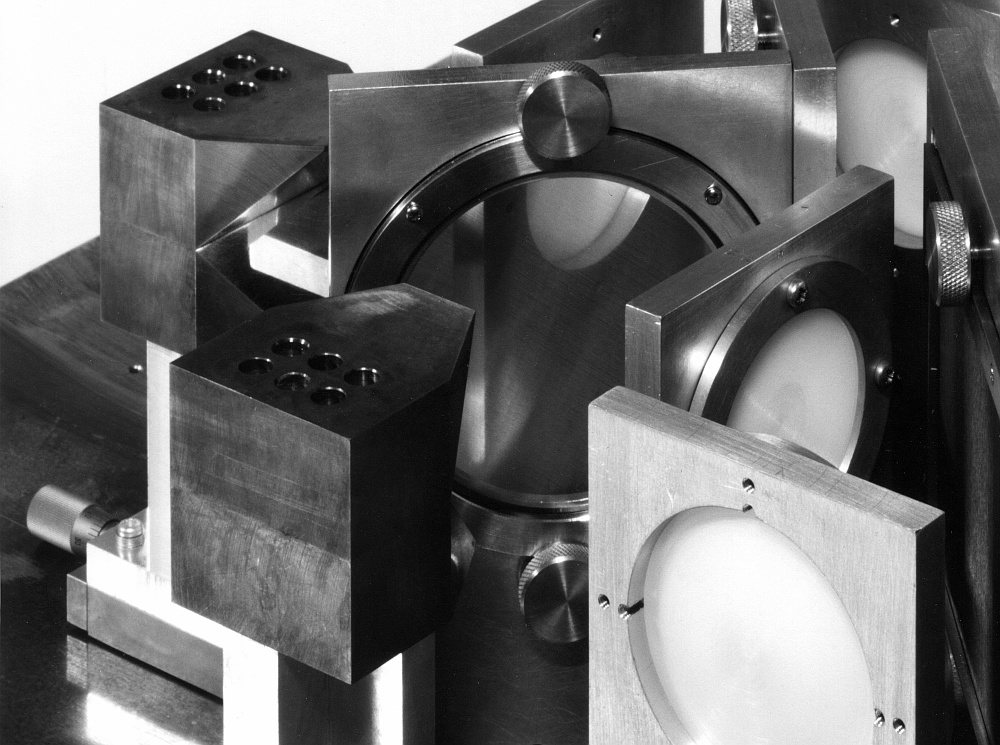
| ‘Duralhenge’ – Prototype optical circuit. | Drawing of lens holder. |
The images above show Duralhenge. The you can see the lenses, polarisers, and roof mirrors in the photo. The drawing gives an indication of the physical size of the system.
As a result of all the tests, analysis, manufacturing, etc, the development process took a fair amount of time and effort, and I learned a number of useful practical skills along the way. Building a test prototype allowed us to check and deal with any problems before making the system that would go onto UKIRT. In practice two slightly different systems were required which we dubbed with amazing originality, ‘System A’ and, erm... ‘System B’.
System A was for use at frequencies around 230GHz and used a shottky diode mixer provided by Dave Vizard.
System B was for the 345 GHz region and used a cooled InSb mixer developed by Glenn White.
Nigel’s main job for the project was to produce a satisfactory local oscillator system. In particular, he had to develop a harmonic multiplier that was a vital part of the local oscillator chain. The local oscillator system for them both used a klystron (type of vacuum state oscillator) running at around 115 GHz whose output was doubled or trebled by the harmonic multiplier diode designed and built by Nigel. These multipliers were very difficult to assemble and get working. They were also quite fragile so had to be made and used with due care and skill.
The klystrons came from Varian and cost thousands of pounds each. Yet they were fragile and only rated to work for around 100 hours of use at full power. They also required 2·5kV at 100 mA but only gave around 100 mWatts output. Their electronic tuning range was quite small, but they had a mechanical screw which could be used to distort their vacuum cavity and alter the tuning. However, using this too many times would tend to end up breaking the expensive klystron. So it was wise to set one to the ‘right’ frequency and then avoid having to adjust its mechanical tuning again. Because of this Glenn over the years had acquired a number of klystrons, each set to a particular frequency. This meant that instead of having to keep making mechanical adjustments, he could change klystron when required, maximising their useful lifetimes. Most observations were at a set of frequencies determined by the spectral lines of some common molecules. In particular, CO (Carbon Monoxide) which has lines at 115, 230, 345, etc, GHz and is relatively common in astronomical gas clouds, etc. Hence the UKIRT systems being nominally optimised for 230 and 345 GHz.
The decision to make a benchtop prototype was vindicated as soon as tests using it began. I had been given an early version of the mixer that Dave Vizard was developing, and used this with a 230 GHz source to start checking the operation of the optical system. My first reaction was excitement and pleasure. The system worked! It is hard to explain now, but at the time I’d never seen anything like it. The signal source and mixer weren’t even looking directly at one another. To get from the source to the mixer the signal power had to find its way around the path, having its polarisation state altered by each element and passing though the – opaque to the human eye – lenses. When you think about it, there is something almost magical about a polarizing two-beam interferometer. The signal power can only get from the input to the output because it had been divided into two differently polarised halves and sent via different paths, then neatly recombined again.
Close-up of a henge |
As you can just see in the photos of ‘Duralhenge’ one of the roof mirrors was mounted so that it’s position could be altered. The theory was that this would cause the efficiency with which power got from source to mixer to vary sinusoidally with that mirror’s distance from the angled polariser. There was something magical about being able to wind the micrometer which adjusted the mirror position and watch the meter connected to the mixer show how the power did, indeed, vary as theory said! However it soon became clear that even when adjusted for maximum efficiency not all the power was getting into the mixer. After some tests and some head-scratching I finally diagnosed that the mixer was, itself, reflecting back some of the power. The trick I used to check this, and then fix it, was to experiment with placing thin sheets of polymer (mylar) in front of the mixer and observe the effect they had.
Such sheets had been used for some years already as semi-reflectors. e.g by choosing the right thickness and material you could reflect, say, 10% of the power whilst passing the rest. But in this case I could mimic the same behaviour as the mixer. That in turn allowed me to find a sheet of mylar that reflected the same amount as the mixer. When I then moved that in from of the mixer I could find a location where the two reflections – from mixer and sheet – cancelled out because they were 180 degrees out of phase. The result was to get more of the power into the mixer. (Microwave and communications engineers will be familiar with similar situations where they need to minimise reflections and maximise signal power transfer.) From this I took the lesson that the final system destined to be used on UKIRT needed to include some way to ‘tune’ the precise mixer (and local oscillator) positions as well as providing places for mounting added sheets of reflector if they should prove to be needed. So this experience caused me to improve the design in practical terms.
In the end, the mixer provided for UKIRT actually had a much lower inherent reflection level than the early example I’d been given to use for initial tests. But the ability to adjust was still available to minimise similar problems from elsewhere in the whole optical system once the telescope’s own optics were included. It also proved useful for the designs of later mm-wave telescopes, but that’s another story...
Although the central part of my work was on the optics for the UKIRT receivers, by mid 1979 I had also become involved in a more general argument that was taking place. UKIRT was primarily designed and built for use making infra-red astronomical observations. i.e. at wavelengths of, say, tens of microns. However the the mm-wave systems, as the name indicates, were for detecting signal wavelengths of a millimetre or more (e.g. about 1·2 mm for 230GHz). UKIRT would work, but wasn’t ideal for mm-wave observations.
By then the UK Research Councils had agreed that a telescope designed specifically for the mm-wave region was required. This was initially given the inspiring name ‘MMT’ or Milli-Metre Telescope. But was later re-named as the ‘JCMT’ or James Clarke Maxwell Telescope. UKIRT had a primary mirror 3·8 meters in diameter, made using the traditional way for optical telescopes from a block of glass, ground to shape, and silvered. The JCMT was to be made using methods more like those used for microwave dishes and would look more like a radio telescope. And would have a primary mirror 15 metres in diameter. In those days this was regarded as huge mirror for use at such frequencies. But it would collect far more signal and provide a much better angular resolution than UKIRT for mm-wave sources. The issue which people continued to argue over was simple: Where should JCMT be located?
For astronomers this question could be answered quite simply. It should be put at the ‘highest and driest’ site possible. For mm-wave radiation the main factor that affects how much signal can get though the atmosphere is the amount of water vapour in the way along the line of sight. However the powers-that-be then faced two problems. Firstly, there wasn’t much reliable data over which site was the ‘highest and driest’. The main contenders at the time were Mauna Kea on Hawai’i and a site somewhere in the Canary Islands. Mauna Kea was certainly higher, and probably drier. But would cost far more to operate and have astronomers travels to and from and stay. So the said powers-that-be kept wondering if the Canaries would do. The situation was complicated because almost all the relevant measurements on levels of water vapour had been taken with an instrument which some were arguing might not be telling us what we really needed to know...
During the 1970s infra-red astronomers routinely used a specific water vapour meter design. This was in a case about the size and shape of a shoebox. To use it, you pointed the meter at the Sun and it let you measure the effect on the amount of infrared light arriving caused by a water vapour absorption feature in the near infrared. But there was a nagging worry that perhaps this result might not be reliable as a way to predict the atmospheric losses in the – far longer – mm-wave region of the spectrum. So in 1979 a set of people made an expedition to the Canary islands to try and resolve some of these questions. We took along some of the standard water vapour meters. But we also needed a way to assess the atmospheric absorption at millimetre wavelengths.
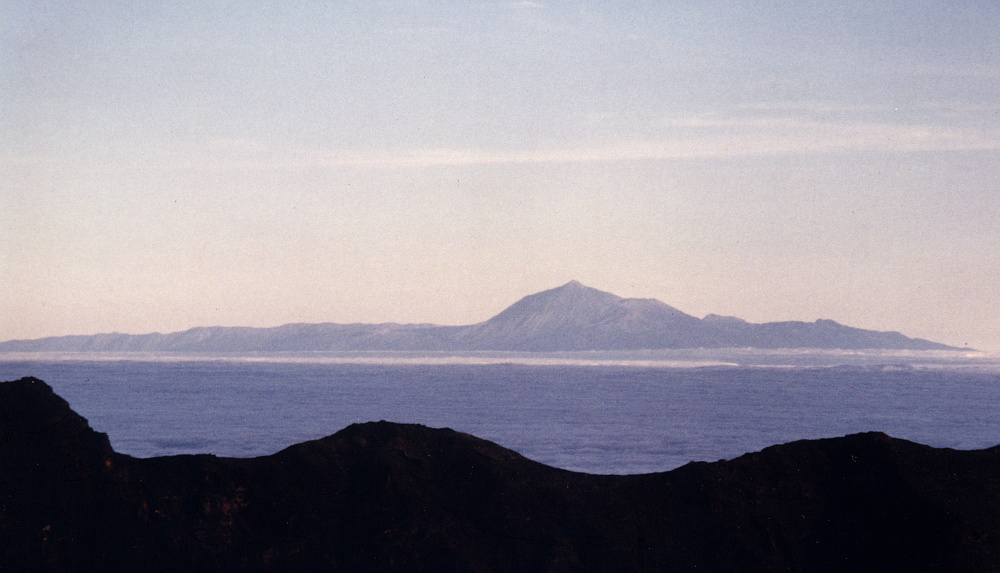
Photo of Tenerife from La Palma. |
At the time Derek’s group was developing a mm-wave interferometer destined to be flown at high altitude on a balloon to make measurements of the Cosmic Background Radiation. This system was being developed by QMC and PCL (Polytechnic of Central London). It was decided to try taking this to the Canaries to let us make parallel sets of measurements in the infra-red and millimetre ranges so they could be compared. I was one of the people roped in to help.
The main observations were based on Tenerife, at the Izaña site already in use by various telescopes. In total, the trip was planned to be from 27th August to 1 October. But not every observer was to be there for all that period. Ian Robson and his spouse, Chris, went out on the 27th of August to start preparations at Izaña. On the 3rd of September three of us flew out. Myself, Bill Duncan, and Chris Zammitt. Bill was a postdoc working for Derek on the cosmic background experiment. Chris Zammitt was a computer programmer from PCL who were responsible for the computing system that controlled the instrument and collected the data. Derek and Eddie Puplett were due to fly out two weeks later, and I’d come home a week after that.
From the moment I arrive it was clear that there were problems. When Chris Zammitt had put the computer system together and switched it on, what electronic engineers call the ‘magic smoke’ had emerged from it. It then duly failed to work properly. Chris spent a few days trying to ‘re-program’ the computer system and get it working. Whilst Ian and I – who knew nothing about the details of the computer – kept asking how trying to change the program would deal with a problem that caused smoke to rise?! Then when we awoke one morning, Chris had gone. He had taken one of the hire cars, driven down to the airport, and flown home early. So far as he was concerned, the attempt was over. Ian looked at me and said words to the effect, “Well, you’re an electronic engineer and have used computers, can we fix it?” My response was along the lines of, “Dunno! But we can have a try!” To this day I have no idea exactly what functions the parts which had ‘lost smoke’ did, but I started having a look.
These days it is probably necessary to remind people that although the computer we had at the time was far less powerful than a modern mobile phone, it was the size of a desk or bookcase. The logic circuits were on a set of circuit board ‘cards’ plugged into frames inside its cabinet. So we opened it up and started looking at each board. Some integrated circuits and other items showed clear signs of damage. Fortunately, these were all standard ICs whose part numbers we could read. So Ian and I took a walk around the site to see if anyone else might have any spares. If I recall correctly, we, erm, liberated some from the Imperial College hut. I then carefully unsoldered the suspect originals and replaced them. Then plugged things back in and switched on. No more smoke, but still not working properly.
So we examined each board individually. Some when connected to power drew strangely high or low current. Looked OK, but I cut some of the tracks to find which rows of devices seemed suspect. Then replaced the ICs in that row and reconnected things. This gave more plausible currents. After some trial and error, the computer started working and could be programmed and used. I still have no idea what, exactly, I did, but it worked. Sadly, it turned out that there were other problems with the system. Hardly surprising because it was still under laboratory development and wasn’t really designed to be crated up a mountain and used out on the mountainside.
Worth mentioning at this point that Chris Robson throughout made the entire trip bearable by her willingness to help out, She sympathised with us all having to put up with Ian’s ‘Tigger’-like behaviour and singing at the top of his voice in the mornings to wake us all up. She also tried to warn us when Ian suggested we go for an ‘interesting walk’ one day when we’d taken a break and driven the hire car to near the base of one of the peaks, Guajara. But Bill and I were gullible... erm young and innocent, and we didn’t realise what Ian meant by ‘interesting’...
Guajara. An interesting walk – Up the steep side and down the easy way! |
At first we were simply walking over volcanic pumice that was like scree. (If that’s the right term.) But as we continued the slope got steeper and steeper and it was easier to keep climbing than try and walk downwards. The rock was firmer, but easily crumbled or broken. Eventually we were climbing using hands as well as feet and it got harder and harder. I recall being in places where an almost vertical cliff rose from a steep slope of loose material. So walking along whilst holding the rock face for fear of sliding away uncontrollably.
I’d assumed that a ‘hike’ or a walk might mean a steep slope or awkward ground. But this was clearly turning into a climb without any ropes or equipment – or, indeed any skill or experience on my part! By this point it was probably pretty obvious to Chris that I was struggling because she was an experienced climber who had tried to warn me. I added to this when I said that I did sometimes get vertigo! So she took pity on me and decided to intervene and rescue me from Ian’s cheerful idea of a ‘hike’. As a result we split the party. Chris took me on via an easier route, leaving Bill Duncan to continue along the more difficult way with Ian.
Eventually we emerged on the gradually sloping side of Guajara and were able to walk down relatively easily. At this point I realised my hands were bleeding having been cut repeatedly by the volcanic rocks I’d gripped. I’d been so focussed on not falling that I hadn’t noticed as I climbed! The way down from there was a leisurely stroll back to the car. At the time I don’t think I knew how Ian and Bill had fared – apart from the fact that Bill had managed to survive the experience! However more recently Bill has told me what happened, and I can best explain by recounting what he has now told me...
|
“I remember climbing Guajara - much to my embarrassment! Ian and I decided to try climbing down a cliff while you and Chris took a different route. I had never done any climbing before but thought with Ian as guide, it would be fine. We got to this one point where getting down that section involved hanging from the cliff by one arm and reaching for hand and foot holds out of sight - Ian, of course did it easily but I got to the point of not trusting my strength to let myself find the next holds and footing and started to shake uncontrollably. Thought I was going to fall and knock Ian off the cliff too (he was worried about that, he told me later). Anyway, had to ascend back up the rocks and walk down the long way, trying to be as fast as possible - I remember the strong spider webs I had to push through before getting to where you were waiting! Quite a time!” |
I also have a vivid recollection of the spider webs that were stretched via a remarkably strong set of threads from bush to bush. Of course, we hadn’t taken any climbing gear or ropes, and I’d never even thought of trying a climb like it before. So an ‘interesting’ walk, indeed... I would like to thank Chris for ensuring I lived beyond that day! After it, I tried to pay more attention to what she said.
The mm-wave interferometer used cooled detectors. These required a supply of both liquid Helium and liquid Nitrogen. We had brought in a large liquid Helium dewer, but liquid Nitrogen was available from the University on the island. On one occasion I and some of the others drove down the mountain to fill up a dewer with Nitrogen. The storage dewer we were using had lost its cap. So, instead, we were using a rag which was gently stuffed into the top. Anyone familiar with liquid Nitrogen knows that you need to be careful about allowing too much air into the dewer. This is because the boiling point of Nitrogen is lower than that of Oxygen. Hence if air can get in, atmospheric Oxygen can start to liquefy in the dewer even as the Nitrogen boils. In a glass dewer or when you pour out the result you can see that the liquid develops a blue tinge. Although liquid Nitrogen is clear and colourless, liquid Qxygen is blue – and can easily help a fire to start.
The purpose of a cap is to limit the flow of gas. The idea is that it leaves a narrow gap which the boiling Nitrogen can escape though, but that flow then prevents any air from getting in. Hence the rag was to serve the same purpose. However having filled the dewer we put it into the hire car on the floor between the front and back seats. Then started driving back towards the site. As we were driving along the coast motorway the dewer fell over. At that point the liquid started to pour out. The cabin of the car promptly filled up with mist to a level that came part-way up the windows. I was in the front passenger’s seat and had to turn around and reach down into the mist to find the handle on the dewer to pull it upright again. Hoping as I did so to avoid actually come into contact with the flow of liquid! Fortunately, I managed to right the dewer and we wound down the windows until the mist departed. I also briefly cracked open the passenger door to make it easier for the liquid to escape. Throughout all this the driver had continued to keep going because we were in traffic and there was no immediate place to stop.
We then carefully drove the rest of the way back. I’ve have wondered since what this must have looked like to people in nearby cars. The inside of the cabin of our car must have looked like something out of a horror film, with a layer of cloud that hid anything below our chests. And there was almost certainly lots of liquid pouring out under the doors, perhaps leaving a trail of mist behind us. If in-car air conditioning had been common at the time maybe they’d have assumed we’d set it just a tad too high!
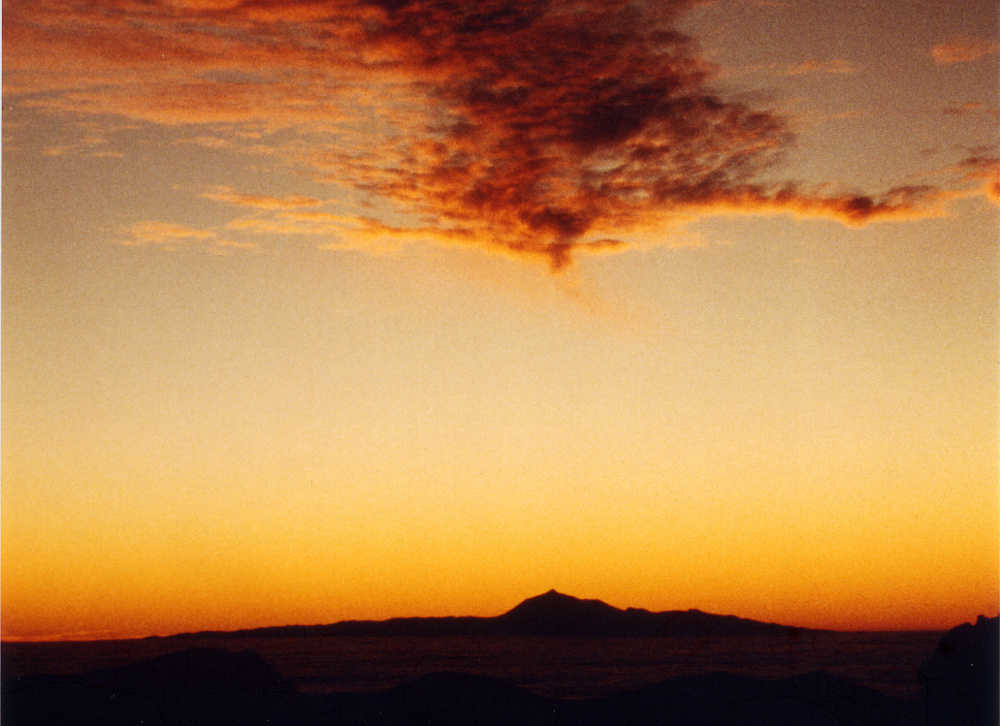
Effect of airflow over Tiede as seen from La Palma |
During the expedition I’d been taking regular readings most days with the standard water vapour meter. The initial plan was to continue with this at Izaña. However on the 15th September I was told that there was to be a change of plan. I was asked by Ian to go with the meter to La Palma and take a series of measurements there so it could be compared with the Tenerife site. Despite the ‘interesting’ trip up Guajara, I agreed like a lamb. I duly arrived on La Palma on 17 Sept and waited in the bar where it had been arranged that I’d be met by a Swedish astronomer from their Solar Tower which would be the base for the measurements I was to make. He arrived, saw my bag and asked where my bedding was. No-one had mentioned this was required. We’d been living in one of the huts at Izaña and this side-trip wasn’t on the original plan. Fortunately, I had enough money to buy a couple of blankets, and food, and we set off in Sven’s landrover.
This trip was also ‘interesting’ in the Ian Robson sense, but – fortunately – to a lesser degree of intensity! The road up to the Solar Tower was cut roughly from quite steep mountainsides. Winding and very narrow. In many places no sign of anything but air out of one side window of the landrover as Sven struggled to keep on the road. The Solar Tower was located virtually on the caldera rim with a steep cliff falling away just a few steps from the tower. Not a place for sleepwalkers! I’ve been told that, later on, the Tower was moved down the mountainside a little and a much better access road was built. It has now been joined by various other telescopes. But when I was there it stood alone.
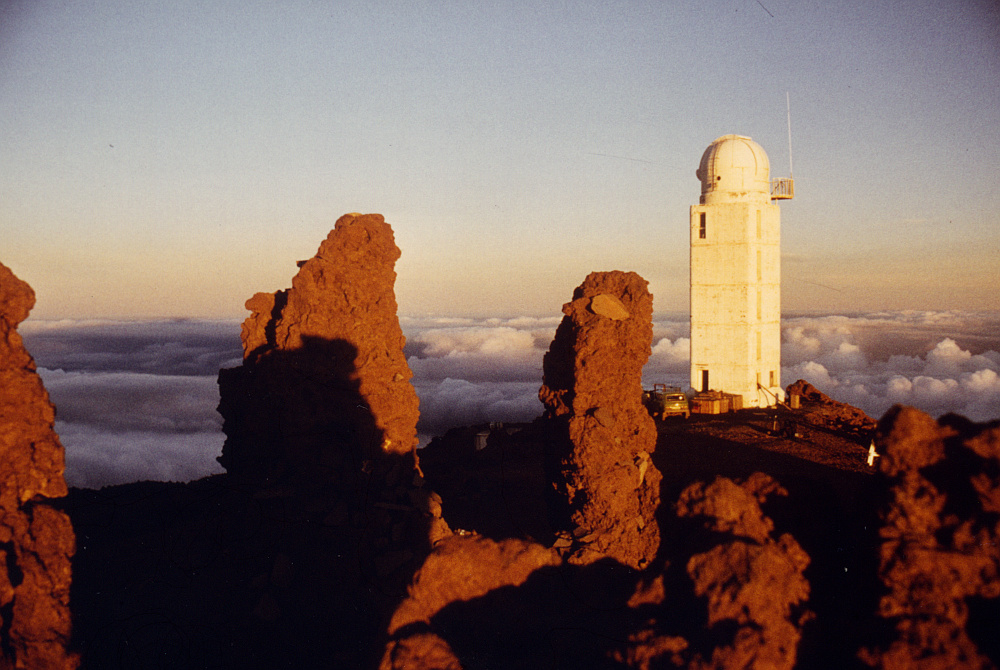
Solar Tower with Roque de los Muchachos |
I stayed on the first floor of the Tower in a storage room that had a basic bed. (The ground floor was the kitchen.) It was very cold and noisy due to the wind, but the blankets took some of the edge off the cold. The actual telescope and its dome were on the top – i.e. fifth – floor. As is the norm for telescopes built to observe the Sun the design of the building was aimed at lifting the telescope as high above the ground as possible. This is because the sunlight heats the surface, causing rising convection currents in the air above. They then cause ripples in the air that disturb the transmission of the light, blurring observations. However the effect reduces if you can get a bit higher, away from the ground. The result – particularly if you are on a mountain ridge – is a telescope that is very high and exposed. So not necessarily a comfortable place to be in a storm!
The food was also pretty basic cook-your-own. Again I’d had no warning of this and had to hurriedly buy some food before going up to the Tower. I found over the first few days that Sven also wasn’t that interested in talking and felt I’d been imposed on him. He also seemed at times to keep playing with the kitchen knives in a way that made me wonder if a dead body thrown over the edge would ever be found! However I think he was just bored with being at the Tower.
Except when the weather was too bad to go outside I adopted a routine of regularly taking water vapour readings from the flattened area just outside the Tower. I took measurements every hour or half hour when the Sun was visible and I could aim the meter at it to get a reading. However each reading only took a few minutes. So I started going for ‘interesting walks’ of my own, along the ridges. Compared to my Guajara ‘walk’ these were, indeed, just a walk. I didn’t tackle anything steeper than about 45 degrees or which looked like scree. So only needed my hands for guidance and stability rather than having to anxiously clutch rocks to avoid a fall.
After a day or two of this I came to really enjoy taking the walks. I only took them when the site and ridges were above cloud level, but given the linear nature of the ridges I think I’d been able to find my way back even if the clouds had covered me. During the walks it was possible to see the other islands across a sea of clouds.
It can be hard to describe this to anyone who hasn’t a fair spent time above about 8,000 ft. In general, the ‘first cloud’ level tends to be around 5,000 - 8,000 ft. Although there are often other much higher cloud levels. In the morning the cloud level tends to be low. But as the air near the ground warms up during the day, this level gradually rises. It then falls back down again during the night. The air tends to be much clearer (drier) than below first cloud level. So you can see long distances. The light has a sharp quality that you rarely experience near sea level. Nearby islands do look as if they are mountains rising from a vast sea of cloud. Sometimes you can’t see the actual ocean at all, just the sea of clouds.
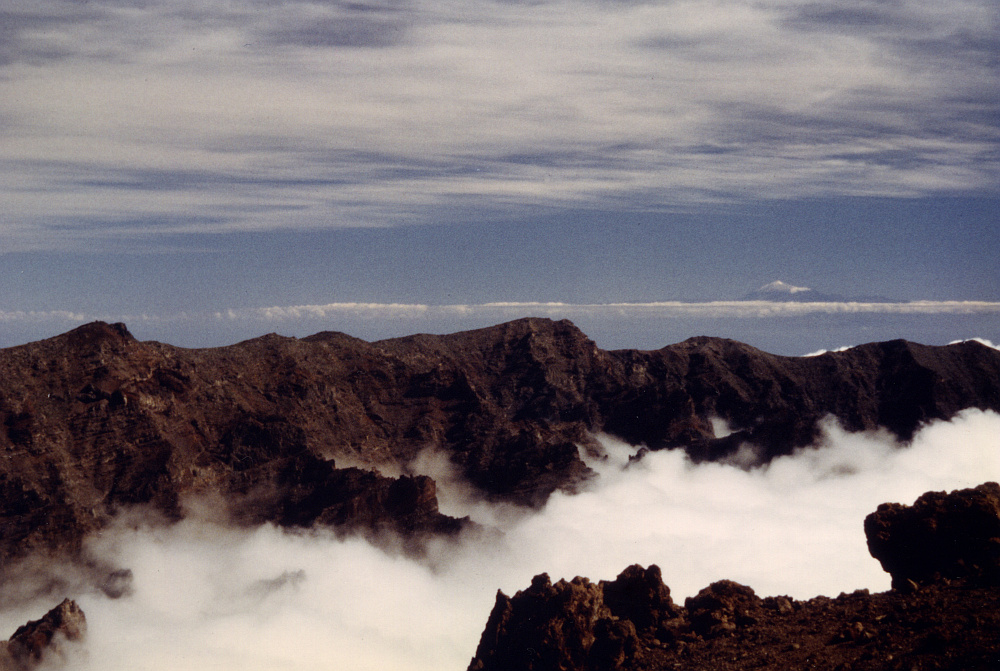
Typical view a ten minute walk from the Solar Tower Shows two cloud levels: one well below the peak of Tiede, the other well above. |
One particular feature of this kind of location was the way I could on some days watch the cloud level slowly rise on the windward/seaward side of a mountain ridge that was lower than my viewpoint and many miles away. Eventually the cloud would start to overtop that ridge, and the result would be a ‘cloudfall’ as vast amounts of cloud started to flow over the ridge and down into the valley beyond. The sheer scale and clarity of this was really impressive. The side-trip to La Palma was one I’d not expected or planned for. And it was uncomfortable and disorganised. But it turned out to be very enjoyable. That said, I had to borrow some money for my flight back to Tenerife on the 22nd. This was partly due to having to spend on blankets, etc, unexpectedly. Also because no-one on La Palma I could find would accept the mainland Spanish Madrid bank travellers cheques I carried!
By this time I was starting to feel like a rugged individual and possible even an intrepid explorer. However the main change it produced in me that has actually lasted was that during this trip I decided it was a distracting waste of time to shave every day. So during the trip I stopped shaving and have, ever since, had a beard.
Alas, the mm-wave interferometer system still wasn’t working correctly when I got back to Izaña. But I then flew home to the UK on the 24th as originally planned. The others continued to work on the mm-wave interferometer for another week or so. But the outcome was such that a later trip to the Canaries was planned to try again to resolve the arguments that were taking place. However that’s another story...
Jim Lesurf
6300 Words
10th Jul 2017
Amended and expanded
1st Aug 2017