The Concorde 1973 Solar Eclipse Data.
During the 1973 Solar Eclipse Concorde 001 was used as a way to “chase the Sun”... or more precisely to try and keep up with the Moon’s shadow and provide an extended period for making observations of the Solar output. By using the Moon as a sliding ‘shutter’ this allowed measurements to be made that would help to determine how the spectrum of the Solar radiation varied across its disc.
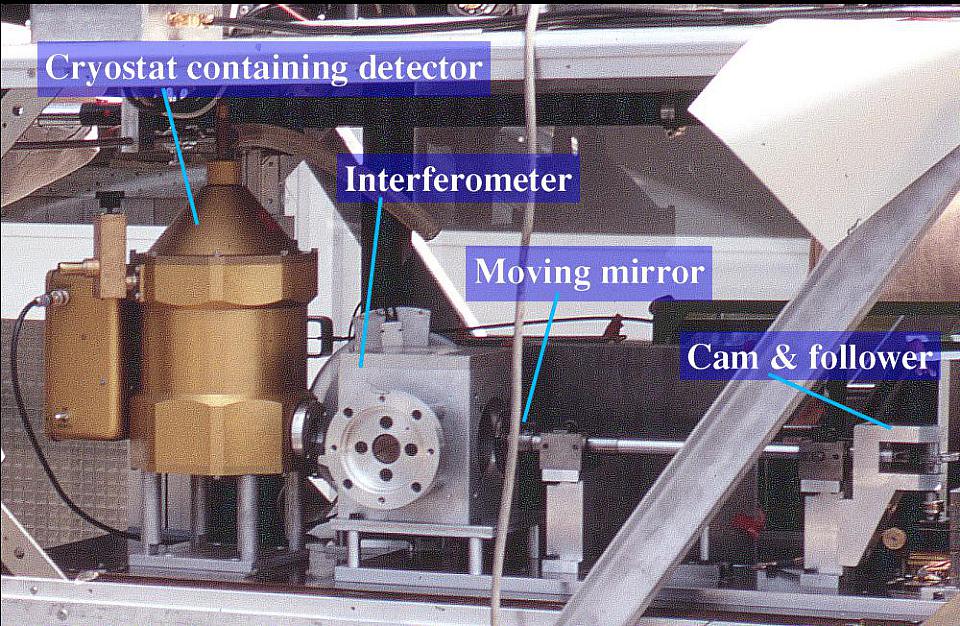
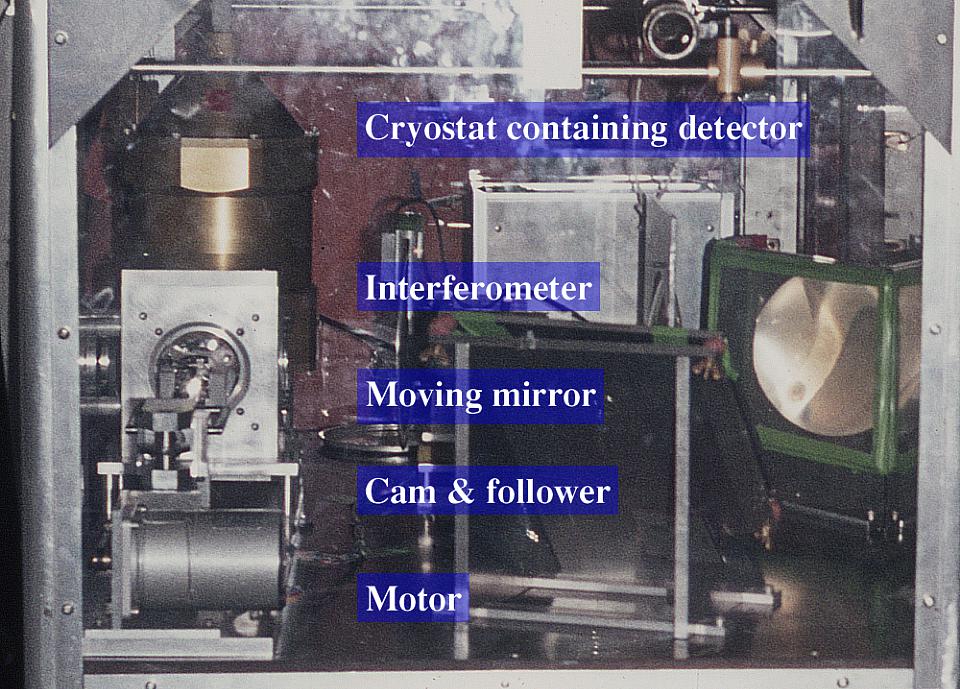
The above photo shows a side-view of the optical and mechanical parts of the instrument used by the QMC (Queen Mary College, now QMUL or Queen Mary University, London) group to collect Far-Infrared data during the Eclipse flight. A copy of this data has now been made openly available so that anyone else who may be interested can examine the data and re-analyse it if they wish. To aid that process, this webpage outlines how the data was collected.
The QMC instrument was designed to observe radiation in the far infrared (FIR) region of the spectrum. This is generally regarded as being at wavelengths between about 10 microns and 1 mm. The actual detector used was a ‘Rollin’ detector which consists of a small piece of Indium Antimonide, cooled in a liquid-Helium cryostat to a few degrees above absolute zero. The FIR input ‘warms’ the electrons in this material, altering its conductivity. This can then be sensed to determine the intensity of the radiation. A Michelson Interferometer was chosen as the instrument to be used for obtaining spectra.
The QMC system was built in a rush because there was obviously a fixed deadline for it to work – the date of the eclipse! The UK’s RSRS research establishment were given the responsibility of supporting the project and they built the power supplies and all the interfacing with the Concorde electronic systems. Tony Marston who was a mechanical technician with the QMC Physics Department’s ‘Astro Group’, designed and built a Michelson Interferometer and its associated optics and mechanical systems. I (Jim Lesurf) designed and assembled the electronic systems that would collect and record the experimental data during the flight. I was a fairly new Ph D research student at the time. John Ross was a final-year Ph D student whose task was to help analyse the resulting data. His main interest in the project was in computing and data analysis.
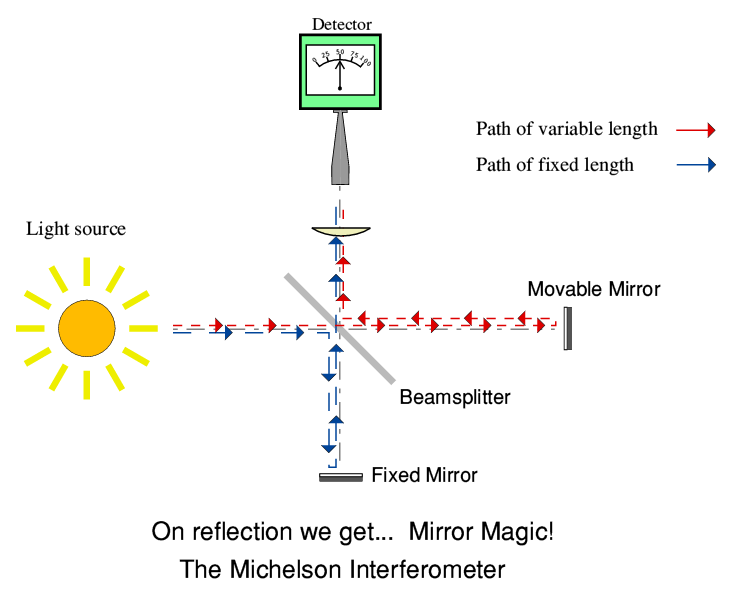
The Michelson Interferometer is a standard instrument described in many textbooks. It employs a beamsplitter to divide an incoming beam of light into a two output beams – ideally with each carrying half of the input power. These are then sent along two distinct paths before being recombined. By varying the difference between the lengths of the two paths we can alter the relative phases of the beams being recombined.
The colours of the arrows in the above diagram are just to distinguish the the two paths that the light can then follow from the input to the detector. Ideally, the beamsplitter does not scatter or absorb any of the light. As we move one mirror we can alter the difference between the two path lengths and there is a interference effect as the two halves of the light reach the detector at different times. The result is that the detected power varies with the path difference in a way that can be used to calculate the spectrum of the input.
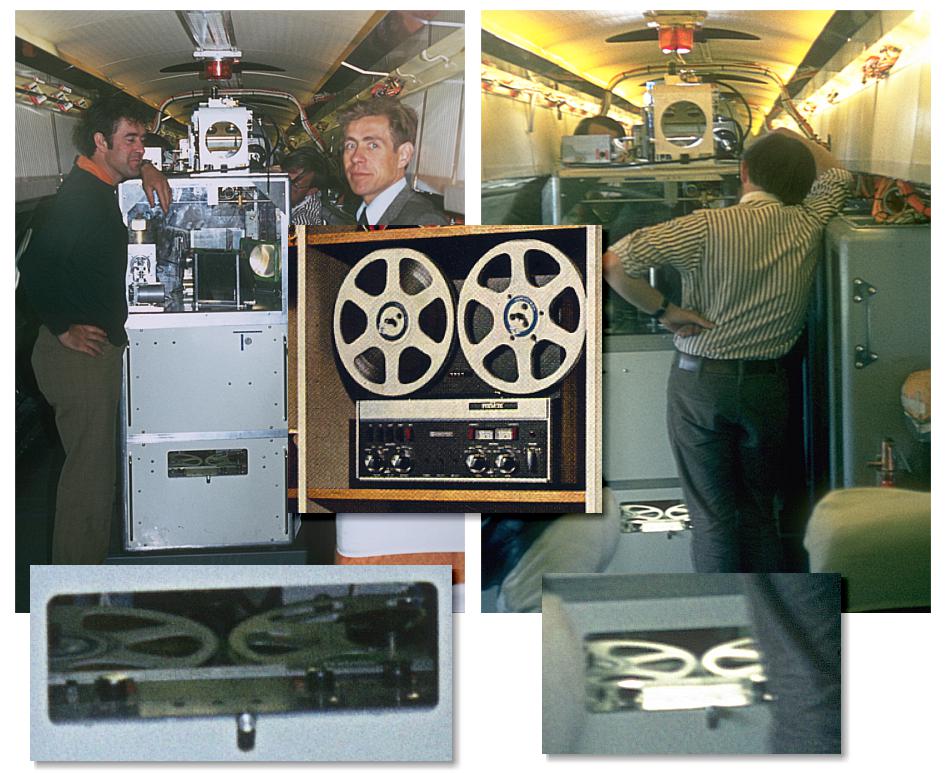
Given the budget allocated I decided that the professional data recorders available at the time were far too expensive (and bulky) to use for collecting the required data. So being a Hi-Fi/Audio enthusiast I hit upon the idea of using a Revox A77 reel-to-reel stereo audio tape deck to record the data. The group of images, above, show the A77. It was fitted into the bottom layer of the instrument and could only then be seen - or operated - via a small opening. I’ve also included a publicity photo showing an A77 in its more usual setting, as part of an early 1970s home audio setup!
The signal patterns we wished to record extended down to near DC. i.e. to subsonic frequencies which the A77 wasn’t built to record. To deal with this I found a box of electronics made by a now long-gone company called “Lan Electronics” which acted as a pair of voltage-to-frequency and frequency-to-voltage convertors. These used the input signals to modulate the frequencies of a pair of square-waves which were in the audio range. As a result, a varying input voltage would produce a squarewave whose frequency altered to indicate the input voltage. This could then be recorded, and the same conversion box would then ‘read’ the frequency on the tape variations and convert that back into the original signal voltage patterns. When tested this worked nicely and showed it would do the job.
As the recorder was a stereo one we could collect two signals in parallel. This allowed us to collect the output of the Michelson Interferometer on one channel, and a timestamped reference ‘clock’ signal provided by Concorde’s electronics on the other. The data recording which we obtained therefore also includes a series of timestamps which nominally specify when each interferogram scan was made. This information is useful as it could then be employed – via knowing where Concorde was relative to the shadow at that time – what parts of the Sun were exposed when a given transform was collected.
In the event, the data recording system worked perfectly. But, alas, there were problems with other parts of the process...
Recently, a digital transfer of the content of the data has been produced. The result is a flac stereo ‘audio’ file with a 192k sample rate and 24 bits per sample. If the file is loaded into an audio processing program like Audacity we can see that the ‘audio’ waveforms do, indeed, appear as quasi-square waves with a frequency of about 1 kHz.
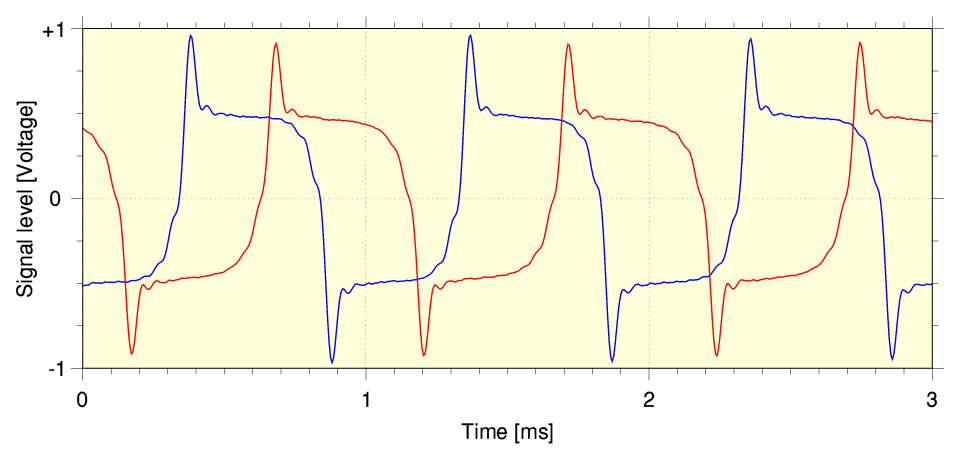
The above graph illustrates a short section of the recorded waveforms with the red and blue lines showing the ‘left’ and ‘right’ channel data of a 2-channel signal. The waves depart from being a neat squarewave as a result of the low-pass filtering applied by the recorder and voltage-to-frequency convertor. One channel records the output from the interferometer. The other records the ‘clock time’ pattern supplied by the Concorde electronic system.
For the sake of initial examination I wrote a simple computer program in ‘C’ that scans though the digital sequences of values and detects the locations of zero-crossings. The difference in time between successive zero-crossings tells us the period of each square wave cycle, and thus the frequency. This approach then allows the program to determine how the waveform frequencies vary with elapsed time thoughout the recording.
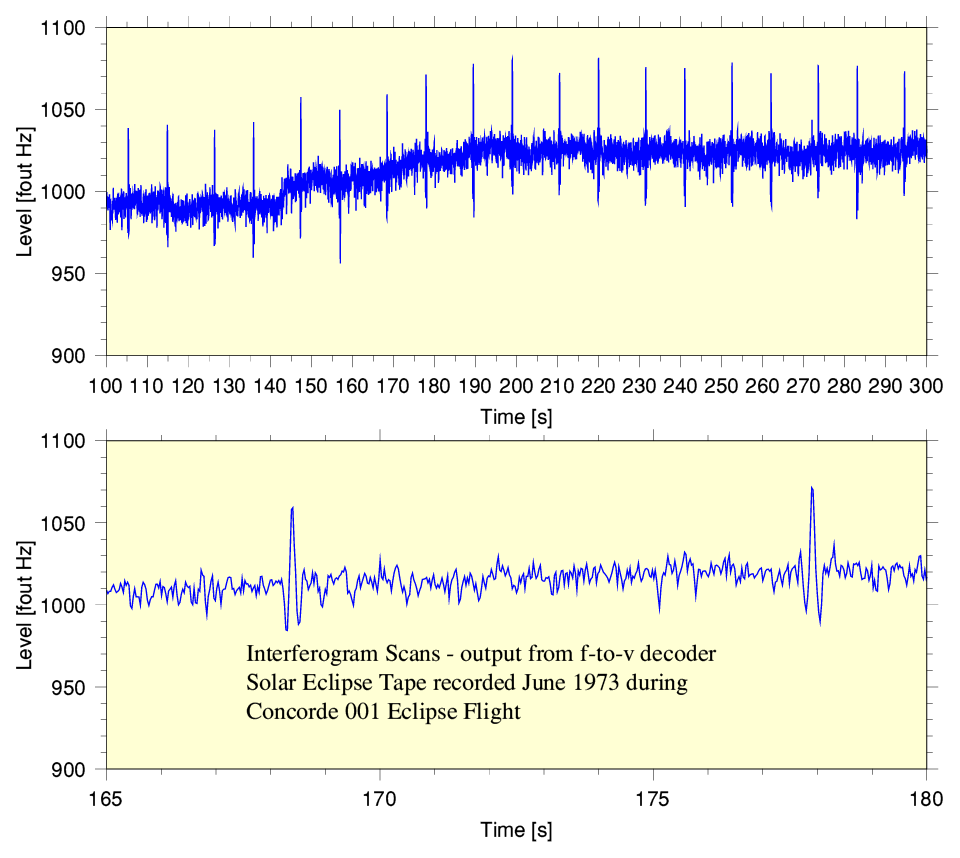
The graphs above illustrate some typical results obtained applying this simple frequency-to-voltage conversion process to the interferogram channel during a randomly chosen section of the recording. When observing a wideband input a Michelson interferometer scan should show an output with a form broadly similar to a sinc-pattern. (A perfectly uniform ‘white’ input light spectrum and ideal detector/interferometer would show an exact sinc pattern.) Each scan gives a central maximum peak as the path difference value passes though being zero. From the above we can see that these peaks indicate a repeat period of around 10 seconds, confirming what was reported in the Letter to Nature. So the above confirms that the data still exists on the tape and is represented in the digital file.
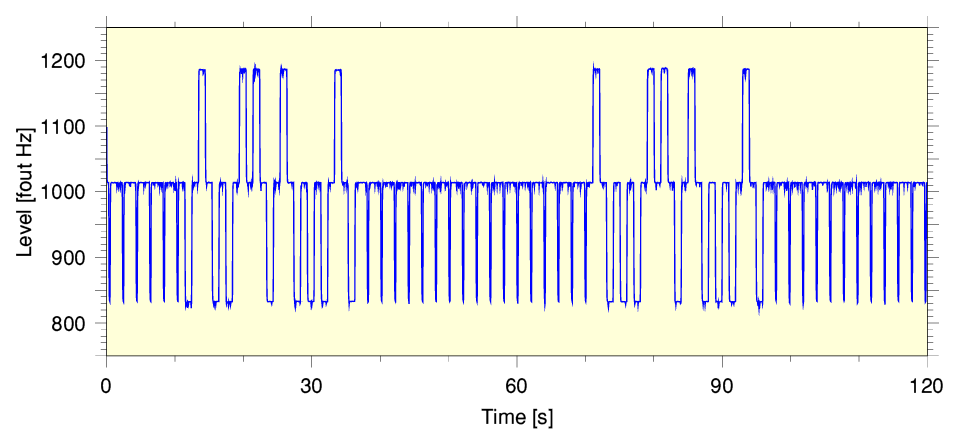
The graph above illustrates the result of frequency-to-voltage conversion of the other channel of the data. This shows the Concorde clock patterns over a randomly chosen period lasting two minutes. You can see that this data is also preserved and included in the recording. In addition to a regular time ‘tick’ there are patterns which indicate the actual time. These probably represent the clock Universal Time.
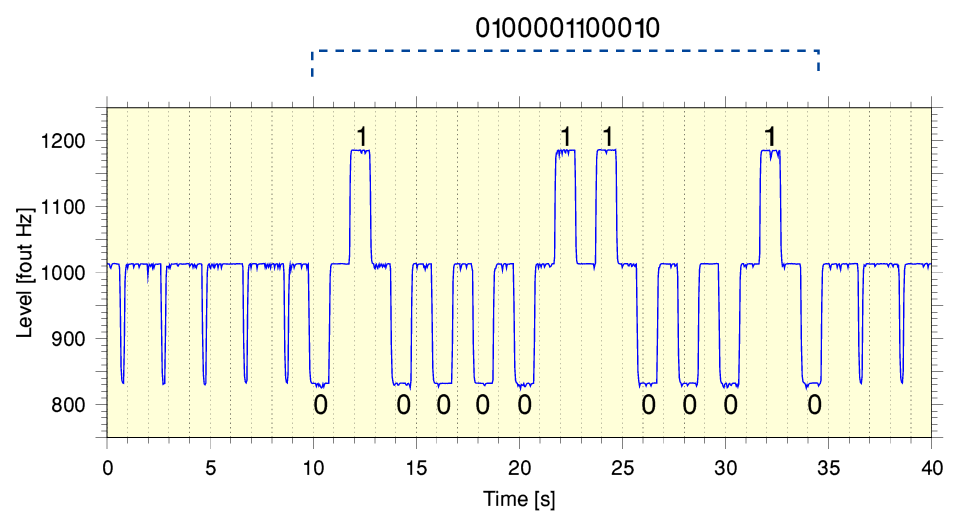
As yet the full format of the coding isn’t known to me or anyone else I have spoken to about the data. However some details have been identified. The encoding seems to represent a ‘1’ via a +ve change in frequency lasting approx. 1 second, and a ‘0’ by a similar negative excursion. Hence the above example can be interpreted as a binary sequence, 0100001100010. It has been suggested that 4 bits are showing the decimal ‘minute’ value +6 (i.e. they repeat the binary sequence from 6 to 15). The next 3 bits represent the decimal for ‘10’s of minutes’ +2, (i.e. they repeat from 2 to 7).
It would be useful to reliably determine the full meaning of the timestamp sequences because this would then enable us to tie each interferogram on the other data channel with the parts of the Solar disc that were occluded at that moment. It may also provide info on any long-term difference between the tape speed when the data was recorded and when it has now been replayed to make the digital capture.
There are a number of other potential imperfections and systematic errors which can impede correctly analysing the data and recovering information about the state of the Sun during the Eclipse.
Firstly, the interferometer scan rate is not well defined. John Beckman reported at the time that he started trying to observe with the system producing 1 scan per second. But then realised this was too fast for the detector to respond with a useful signal/noise ratio. He then slowed down the scan rate to a reported scan every 10 seconds. However looking at the recording now it looks like the actual rate was closer to one scan every 11 seconds - as indicated by the delay between successive interferogram central maxima (peaks).
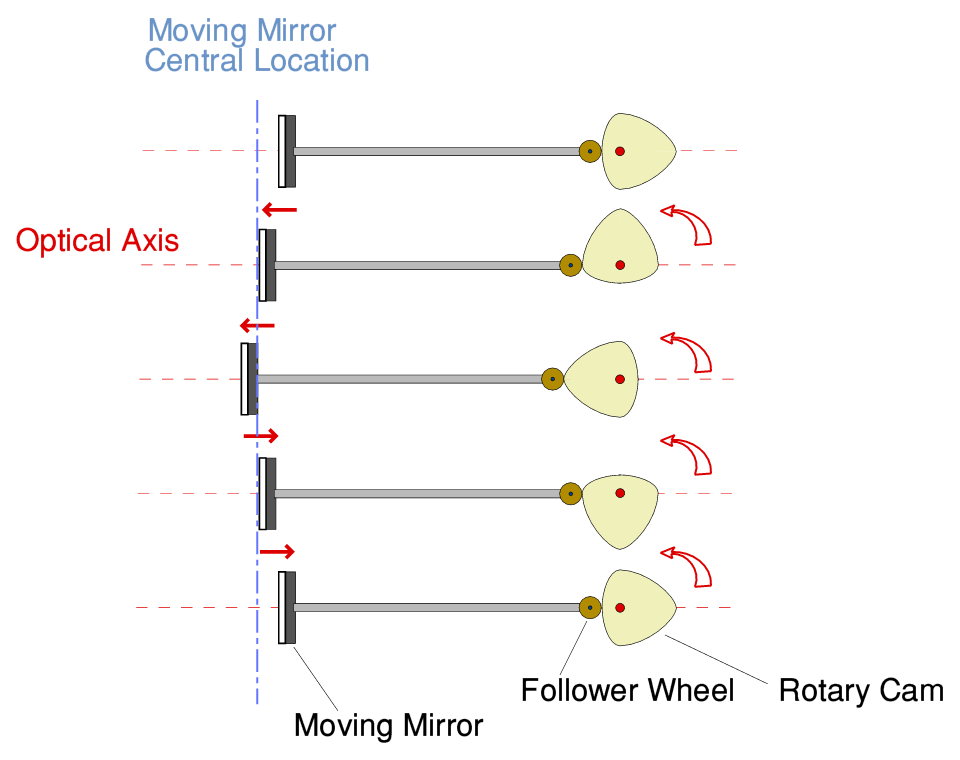
We also know that, alas, the scan rate was not uniform! The scanning process was performed using a moving mirror driven by a ‘cam and follower’ system. This allows a rotary motor to generate a nominally linear movement back-and-forth. The diagram above illustrates this process. The moving mirror is connected to an arm that has a small ‘follower wheel’ attached to its other end. A spring presses this arm and wheel against a shaped wheel. By rotating this wheel we can then cause the wheel - and hence the mirror – to move back and forth along an axis. By choosing the correct shape for the cam this movement can be arranged to be a linear sweep, back-and-forth, with one cycle of sweep back-and-forth per rotation of the cam. The correct shape of the cam required depends on the diameter of the follower wheel. (As a result, in practice, the simplest way to then cut the shape of the cam is to use a mill cutter whose diameter is the same as the chosen follower wheel.)
Unfortunately, Tony Marston who machined and assembled the mechanical arrangements of the system admitted later on that he’d accidentally used the wrong cutter diameter when making the shaped cam that - with the follower - controls the movement. As a result the actual scan speed varied systematically during each scan. This means a correction for this behaviour would be needed to fully resolve spectra from the shapes of the interferograms. But this correction wasn’t applied at the time. As a result, John Beckman and John Ross were only able to extract results with a relatively poor frequency resolution.
The above shows an end-view of the system.
Since the 1970s, of course, the available power of computers has grown considerably. As has the range of computational methods to process large amounts of data. Hence it may be possible today to extract rather more information from the recording that was feasible nearly 40 years ago!
So the big challenge now is discover if anyone can devise and employ more powerful modern forms of analysis to extract information that was concealed in the 1970s by these problems! However even if that isn’t feasible, people may simply be interested in examining the data as a historic document of a unique experiment.
At the time this webpage was written the Eclipse data was downloadable in two versions.
Version 1 is a flac file of the 192k/24bit 2-channel transfer, which should be obtainable from:
https://drive.google.com/drive/folders/1nsAruTPgQysbo2fyt-9NjzDiZoFyoSAyNOTE that the above version is a large file! It is over 2GB in size. For anyone who simply wishes to have a quick look at the data and does not require the full detail.
Version 2 Is just 40MB in size, and is obtainable from:
https://drive.google.com/file/d/1PaEfTr1dc4hdSaGxJmA8Wzqs_MXyeBF_/viewA set of relevant contemporary documents related to the experiment/project can also be found here:
http://jcgl.orpheusweb.co.uk/history/EclipseDocs/EclipseDocuments.html
These files may be freely copied or distributed to anyone interested in examining or re-analysing the data. I would like to thank David Lord of the UK Hi-Fi History Society for his help in producing the digital transfer from the old data tape recording.
2100 Words
Jim Lesurf
6th Nov 2021